








 Crypto News
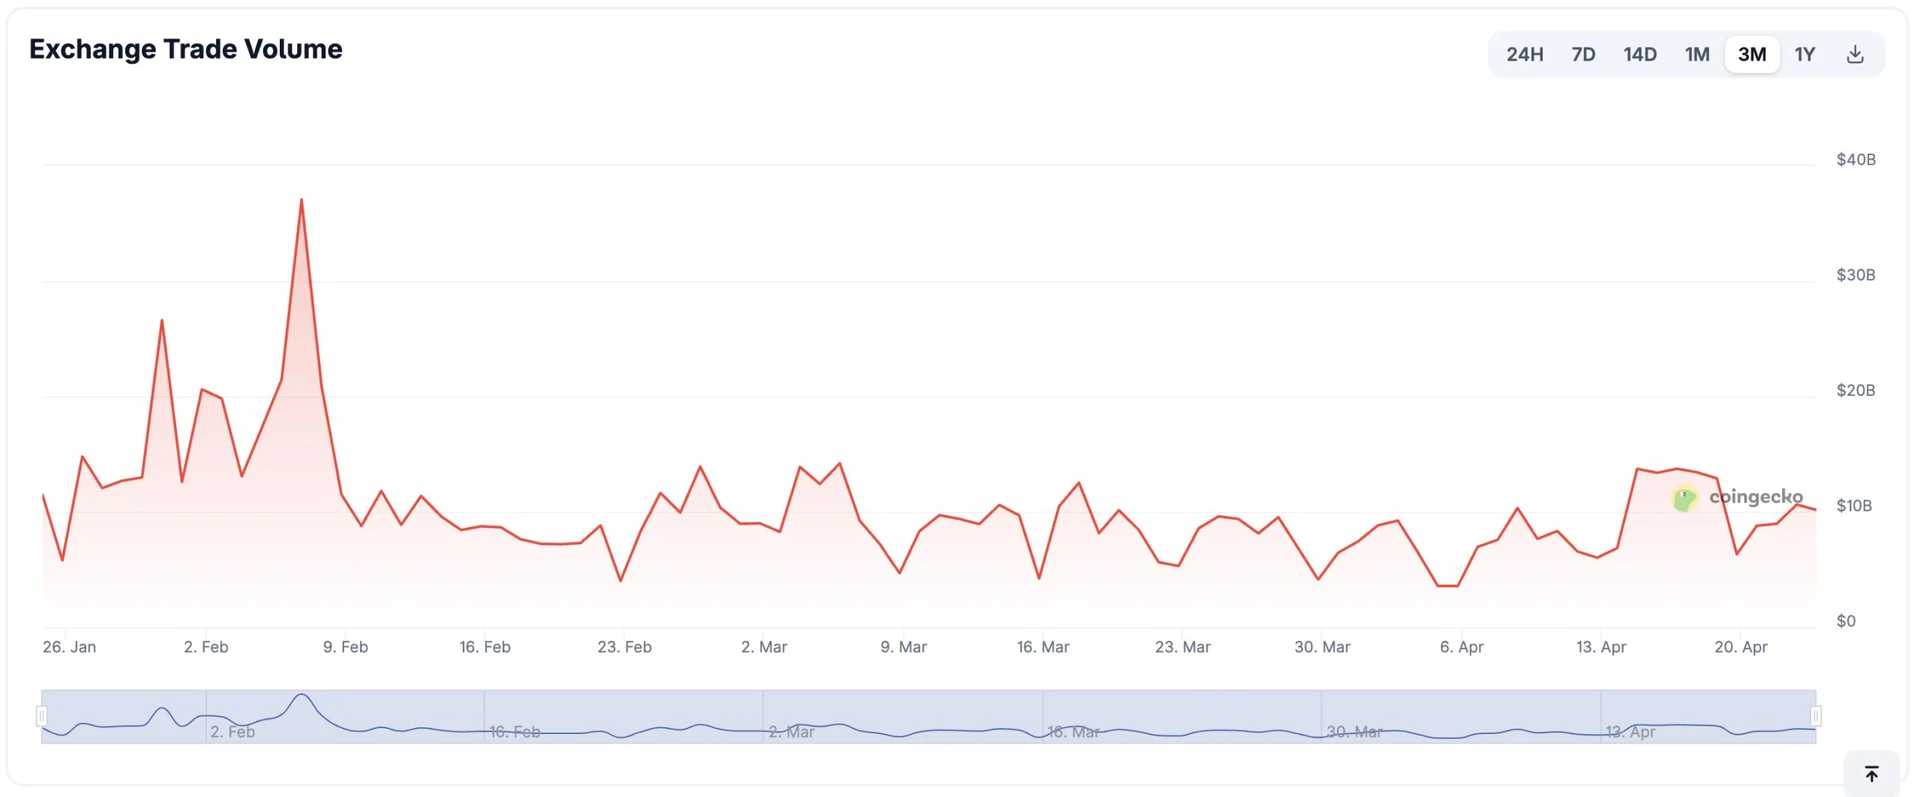


Binance processed more than $1.09 trillion in trading volume over a 112-day window, even as BNB grinds sideways in a tight $620–$650 range. The 7-day SMA holds at $632 against a 100-period SMA floor at $629, with $640 acting as the daily pivot resistance and meaningful supply clustered at $627–$660. Recent 48-hour data shows over $90 million in USDT turnover, with interests stacking near the $625–$640 band.
A separate metric underscores the network's reach: BNB Chain now leads all L1 blockchains with 329.5 million token holders, capturing 18.9% of global market share versus Ethereum's 17.7% — a flip the chain's data team flagged publicly on April 23.
Why it matters
The volume print is the headline counter-narrative to the perpetual "crypto is dead" cycle of social-media obituaries. A venue clearing roughly $9.7 billion per day in spot and derivatives flow is not a market in retreat — it is the dominant venue by a wide margin. Layered on top, the holder-count lead over Ethereum gives BNB a breadth claim that the L1 sector has historically been willing to price in. Bitcoin's 5% weekly gain is doing the heavy lifting on the macro side, and altcoin beta is translating into incremental bid for BNB.
Market impact
The technical setup is genuinely two-sided. The MACD is softening while volume is rising — an unusual divergence that typically resolves one of two ways: a false breakdown that shakes out longs before a leg higher, or distribution into resistance that hands the range back to sellers. A daily close above $640 is the cleanest confirmation signal; a close below $620 reopens the $610–$600 demand zone, with a deeper $507 floor visible if macro conditions deteriorate. The $507 level is a tail-risk read, not a base case — but the asymmetric response is what makes the coil worth trading rather than ignoring.

Frequently asked questions
-
How much volume has Binance processed recently?
Binance processed more than $1.09 trillion in trading volume over a 112-day window, averaging roughly $9.7 billion per day in spot and derivatives flow across the period covered by the source data.
-
What is BNB's current price range and key technical levels?
BNB is trading in a $620–$650 range, with the 7-day SMA at $632, the 100-period SMA at $629, $640 acting as daily pivot resistance, and a deeper support zone at $610–$600 plus a tail-risk floor near $507.
-
Does BNB Chain have more token holders than Ethereum?
According to data cited on April 23, BNB Chain leads all L1 blockchains with 329.5 million token holders, capturing 18.9% of global market share versus Ethereum's 17.7%.
-
Why is the MACD divergence significant for BNB right now?
The MACD is softening while trading volume is rising — an unusual split that typically resolves as either a false breakdown before a leg higher, or distribution into resistance. A daily close above $640 would confirm the bullish resolution; below $620 would invalidate it.
-
What macro factor is supporting BNB's price action?
Bitcoin's 5% weekly gain is the primary macro tailwind, lifting altcoin beta broadly. The source notes that altcoin strength hinges heavily on Bitcoin's direction, meaning BNB's near-term path remains tied to BTC's tape.
 Crypto Rank News
 Lookonchain
 CryptoSlate
 CoinTelegraph
 WuBlockchain