


 CoinDesk
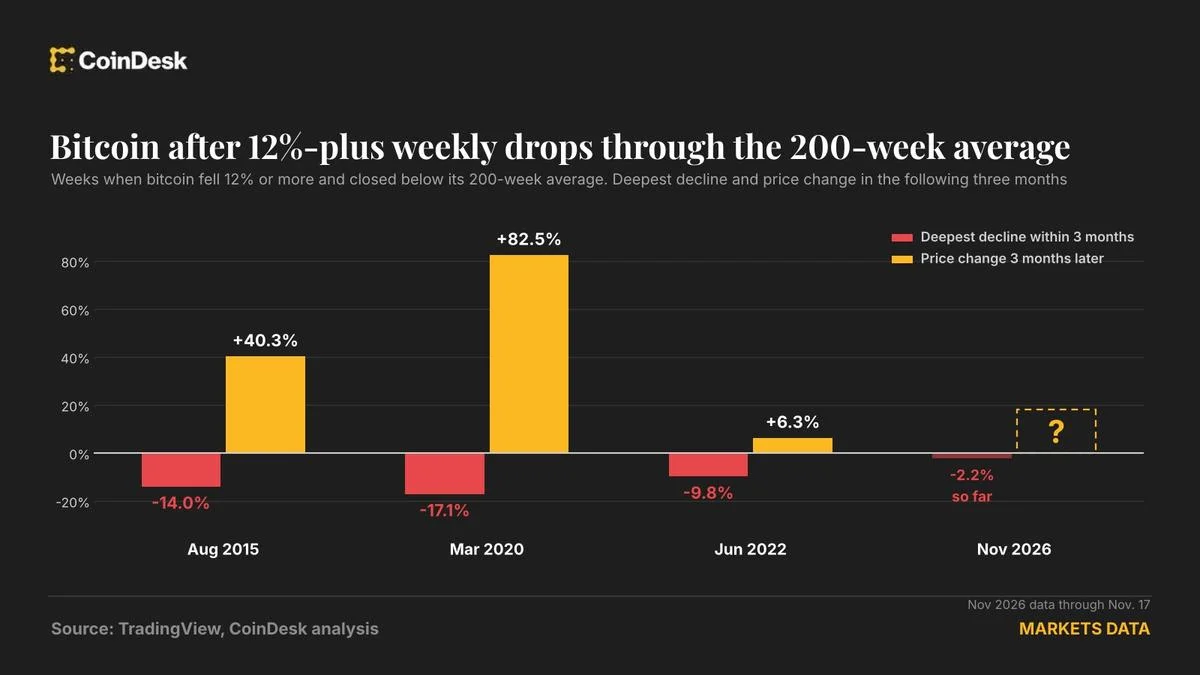


Bitcoin fell 12.6% last week, closing just above $65,000 and breaking below its 200-week simple moving average near $68,000. The decline created a rare technical signal: a weekly loss of at least 12% combined with a break of a major long-term support level. Only three similar episodes have occurred since the average became available in 2013.
Why it matters
The historical record is constructive but not immediate. Bitcoin was 40.3% higher three months after the August 2015 break and 82.5% higher after the March 2020 Covid crash. Following the June 2022 break, it was up 6.3% three months later, although the gains later reversed when FTX collapsed in November 2022 and pushed Bitcoin toward $15,500.
The recurring pattern also includes further weakness before recovery. In each previous case, Bitcoin declined another 10% to 17% before turning higher. Applied to last week's close, that would place a potential low between roughly $54,000 and $59,000, consistent with Wintermute's expectation of prices in the $50,000s.
Market impact
The signal may point to a late-stage bear market rather than the start of a longer decline, but three historical cases do not establish a reliable rule. Persistent Bitcoin ETF outflows and rising bond yields could keep pressure on prices for more than three months.
Bitcoin has recorded 77 weekly losses of 12% or more since 2009, although only four have occurred since the start of 2023. The break below the 200-week average is notable because it combines severe volatility with damage to a widely watched long-term trend measure, leaving macro conditions and ETF flows as the key tests for the historical rebound pattern.

Frequently asked questions
-
How rare was Bitcoin's break below its 200-week average?
Only three similar episodes had occurred since 2013, requiring both a weekly decline of at least 12% and a break below the long-term moving average.
-
What happened after the three previous comparable Bitcoin breaks?
Bitcoin was higher three months later in all three cases, with gains of 40.3% after the 2015 break, 82.5% after the 2020 break and 6.3% after the 2022 break.
-
Did Bitcoin rebound immediately after breaking its 200-week average?
No. In each previous episode, Bitcoin fell another 10% to 17% before turning higher, a range corresponding to roughly $54,000 to $59,000 from the latest close.
-
Which risks could prevent the historical rebound pattern from repeating?
Persistent Bitcoin ETF outflows and rising bond yields could keep prices under pressure for more than three months, even though the previous three breaks preceded higher prices.
-
Does breaking the 200-week average mean Bitcoin entered a bear market?
Not by itself. The three comparable breaks occurred near the end of bear markets, but the limited sample and changing macro conditions prevent treating the signal as a rule.
 CoinTelegraph
 Whale Alert
 Lookonchain
 WuBlockchain
 TheBlock