


 CoinDesk
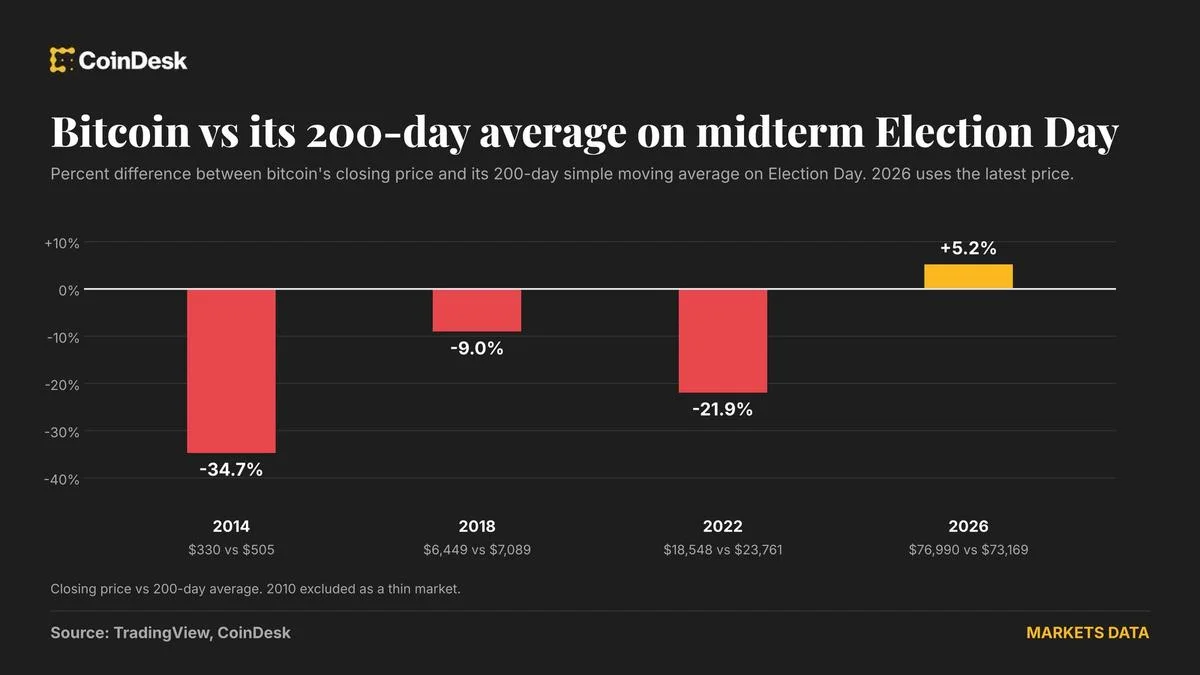


Bitcoin traded near $76,990, about 5.2% above its 200-day average of roughly $73,169, a level commonly used to gauge its long-term trend. That puts BTC on the opposite side of the average from the 2014, 2018 and 2022 midterm elections, when it traded 35%, 9% and 22% below it, respectively.
Why it matters
Those earlier midterm years coincided with bear markets, a pattern often linked to Bitcoin’s four-year halving cycle. BTC peaked above $126,000 in October 2025, but the 2026 downturn was shallow and front-loaded, with much of the decline occurring in January and February. Bitcoin is now back above its 200-day average, breaking from the prior midterm-election pattern.
Past data also shows Bitcoin higher 12 months after midterm elections, though the first few months have historically been choppy to slightly bearish. DWF Labs research lead Martin Lee said the firm is taking a “cautious optimism” approach and flagged near-term volatility, including risks tied to an escalation in war and pressure on risk assets from the AI trade.
Market impact
The election result could influence the near-term trend alongside ETF flows and macro data. The U.S. jobs report due Friday may also affect expectations for Federal Reserve interest rates. Separately, Bitcoin’s 30-day implied volatility index recently broke out of a descending triangle, a chart pattern associated with a potential move higher in expected volatility.
The signal is therefore mixed across time horizons: Bitcoin’s position above its 200-day average challenges the historical midterm pattern, while election uncertainty and upcoming market catalysts leave room for near-term turbulence.

Frequently asked questions
-
How far is Bitcoin above its 200-day average?
Bitcoin traded near $76,990, about 5.2% above its 200-day average of roughly $73,169.
-
How did Bitcoin trade around the 2014, 2018 and 2022 midterms?
Bitcoin traded 35%, 9% and 22% below its 200-day average in 2014, 2018 and 2022, respectively.
-
What contributed to Bitcoin moving back above its 200-day average in 2026?
The 2026 downturn was described as shallow and front-loaded, with much of the decline occurring in January and February.
-
What near-term factors could influence Bitcoin’s market direction?
The election outcome, ETF flows and the U.S. jobs report due Friday could shape the near-term trend. The jobs data may affect expectations for Federal Reserve interest rates.
-
What does the Bitcoin implied-volatility chart signal?
Bitcoin’s 30-day implied volatility index recently broke out of a descending triangle, a pattern associated with a potential move higher in expected volatility.
 Crypto Rank News
 CryptoSlate
 WatcherGuru
 Crypto News
 TheBlock
 Whale Alert
 Lookonchain
 WuBlockchain