








 CoinDesk
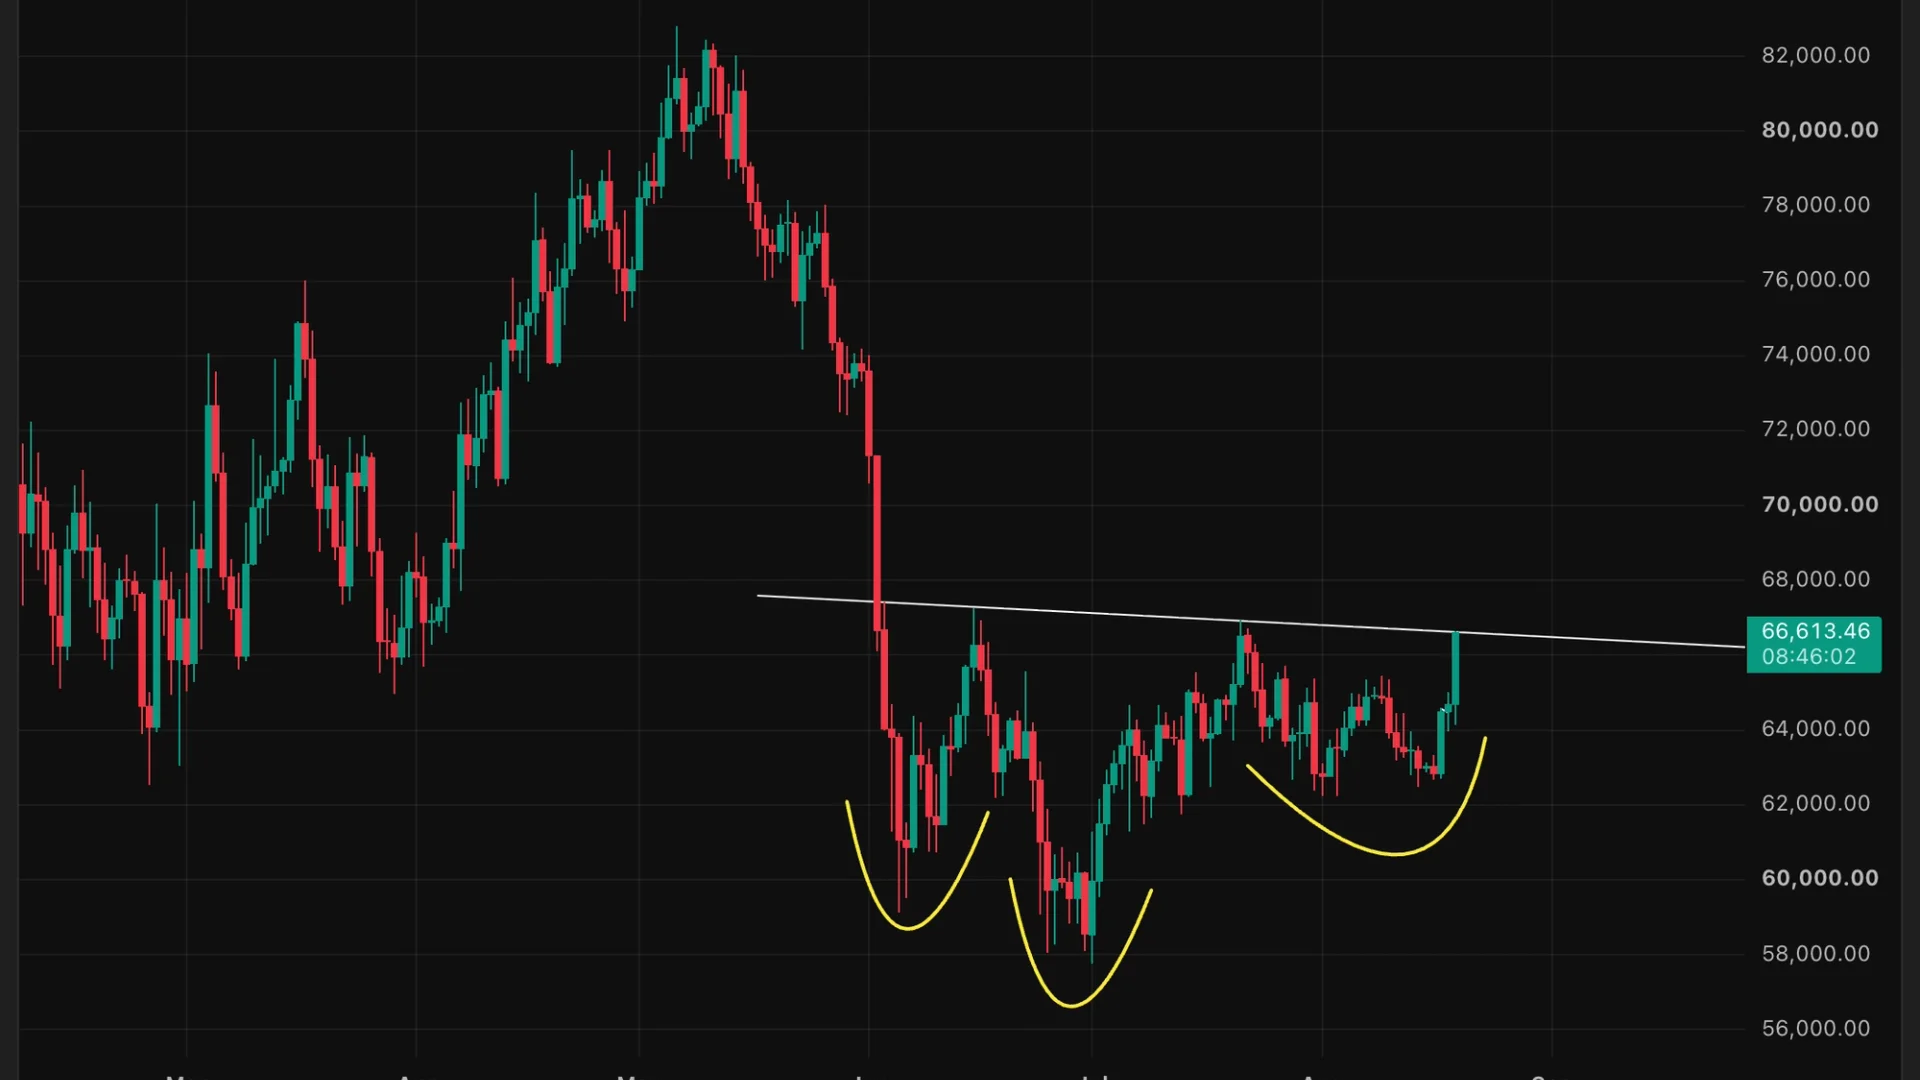


Bitcoin recently changed hands at $66,500, just below the $66,600 neckline of an inverse head-and-shoulders pattern developing on its daily chart since the June lows. Market technician Aksel Kibar of Tech Charts says a decisive break and hold above that level would confirm the setup and produce a measured-move target near $76,000. The formation has three troughs, with the middle one deepest, separated by brief recoveries.
Why it matters
The pattern gives traders a defined technical trigger rather than a broad bullish narrative. The neckline links the recovery points between the troughs, while the $76,000 objective comes from measuring the distance between the pattern's head and the neckline. Until BTC breaks and holds above $66,600, the formation remains unconfirmed.
The structure has been building since early June, following Bitcoin's $126,000 peak in October last year and the subsequent bear market. If confirmed, it would support the view that the market has formed a potential bottom and could be starting a fresh uptrend.
Market impact
BTC is already close to the trigger, so traders are watching for a decisive move through the neckline followed by a hold above it, rather than a brief intraday test. That distinction matters because the pattern's signal depends on confirmation, not proximity to resistance.
A confirmed breakout would put the measured $76,000 objective in focus. A failure to clear or hold $66,600 would leave the bullish inverse head-and-shoulders pattern unconfirmed and keep the neckline as Bitcoin's immediate directional level.

Frequently asked questions
-
What price level confirms Bitcoin's inverse head-and-shoulders pattern?
A decisive break and sustained hold above the $66,600 neckline would confirm the pattern, according to market technician Aksel Kibar.
-
How is Bitcoin's $76,000 target calculated?
It is the measured-move objective derived from the distance between the pattern's head and its $66,600 neckline.
-
When did Bitcoin's inverse head-and-shoulders pattern begin?
The structure has been developing on Bitcoin's daily chart since the June lows.
-
Why does a brief move above $66,600 not confirm the setup?
The setup requires a decisive break and hold above the neckline. BTC trading near $66,500 alone leaves the formation unconfirmed.
-
What would confirmation say about Bitcoin's broader trend?
It would support the view that Bitcoin has formed a potential bottom after the bear market that followed its $126,000 peak in October. The pattern could then signal a fresh uptrend.
 Crypto News
 CoinTelegraph
 WuBlockchain
 Crypto Rank News
 Glassnode