








 CoinDesk

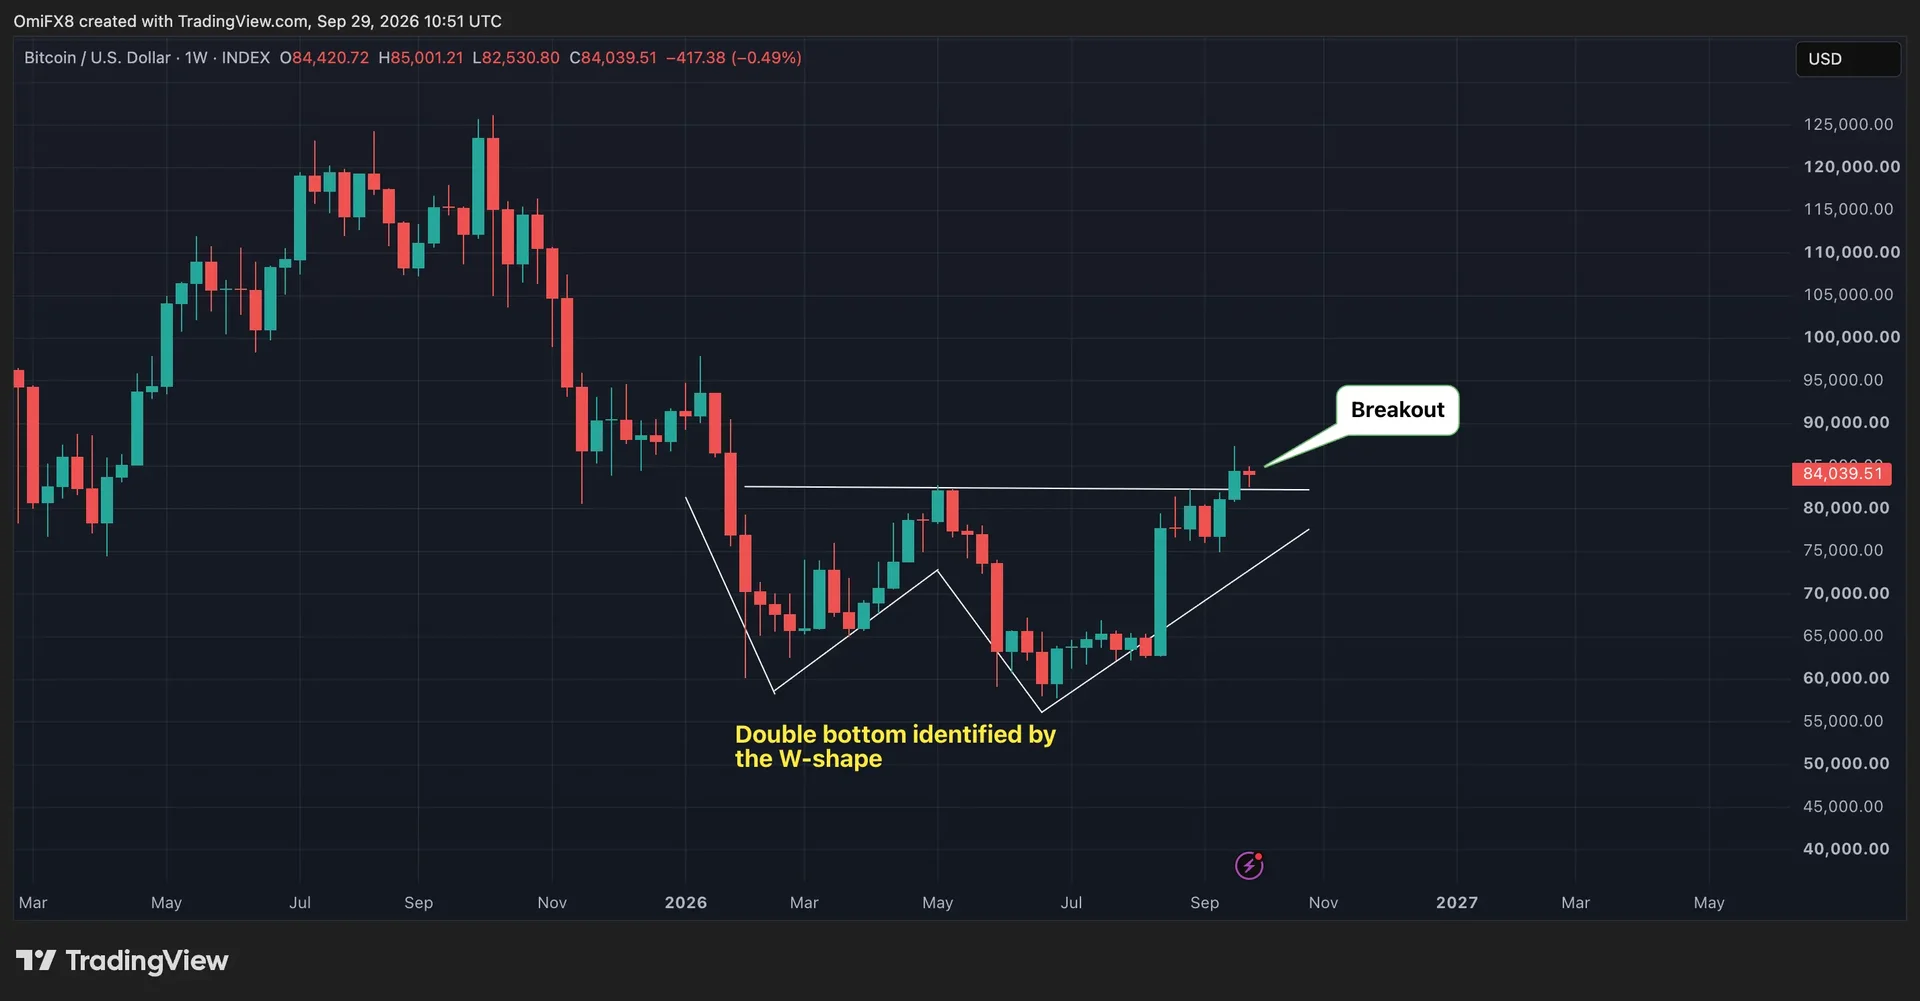


Bitcoin held near $84,000 after briefly dipping toward $82,500 on Monday, when gold fell nearly 4% as longer-duration yields climbed to their highest levels since 2007. BTC slipped about 1% that day and has gained more than 40% this quarter, outpacing gold, the S&P 500 and other major assets.
Why it matters
Fidelity Investments' Jurrien Timmer says Bitcoin's move above $80,000 confirms a double-bottom breakout that could put $100,000 in play. His chart identifies lows at $60,033 and $57,742, with resistance near $82,800 between them. In the pattern, a break above that middle peak can signal that buyers have overcome resistance and a new uptrend may be starting.
The macro backdrop adds context to Bitcoin's relative strength. The dollar index has risen 2.7%, from 98.78 to nearly 101.50, since Sept. 9, while gold fell sharply on Monday. Bitcoin's smaller decline that day and its quarterly outperformance suggest it has held up better than traditional assets over those periods.
Market impact
Options positioning points to traders preparing for further gains. On Deribit, the $90,000 call led Bitcoin options with $2.45 billion in open interest, followed by the $95,000 call at $2.33 billion and the $100,000 call at $1.79 billion. Calls gain value when Bitcoin rises above their set strike price, making the positioning consistent with a higher-price outlook.
Neither the chart pattern nor options positioning guarantees a rally. Breakouts can reverse and trap buyers, while options bets can change as market conditions shift. The $80,000 area and the resistance near $82,800 remain key reference points in the bullish setup described by Timmer.

Frequently asked questions
-
What price levels define the Bitcoin double-bottom pattern?
Fidelity's Jurrien Timmer identified lows at $60,033 and $57,742, with the middle peak near $82,800. He says a break above resistance supports the pattern.
-
Why is $100,000 a target in the Bitcoin outlook?
Timmer says Bitcoin's move above $80,000 confirms a double-bottom breakout that could put $100,000 in play. The pattern is not a guarantee of further gains.
-
Which Bitcoin options strikes have the most open interest on Deribit?
The $90,000 call leads with $2.45 billion in open interest, followed by the $95,000 call at $2.33 billion and the $100,000 call at $1.79 billion.
-
How did Bitcoin perform against gold on Monday?
Bitcoin slipped about 1% and briefly neared $82,500, while gold fell nearly 4%. Bitcoin was trading around $84,000 at the time of the report.
-
What could undermine the bullish Bitcoin setup?
Breakouts can reverse and trap buyers, and options positioning can change quickly as market conditions shift. Neither the chart pattern nor the options bets guarantees a rally.
 Crypto News
 Glassnode
 Crypto Rank News
 CoinTelegraph
 TheBlock