








 Glassnode
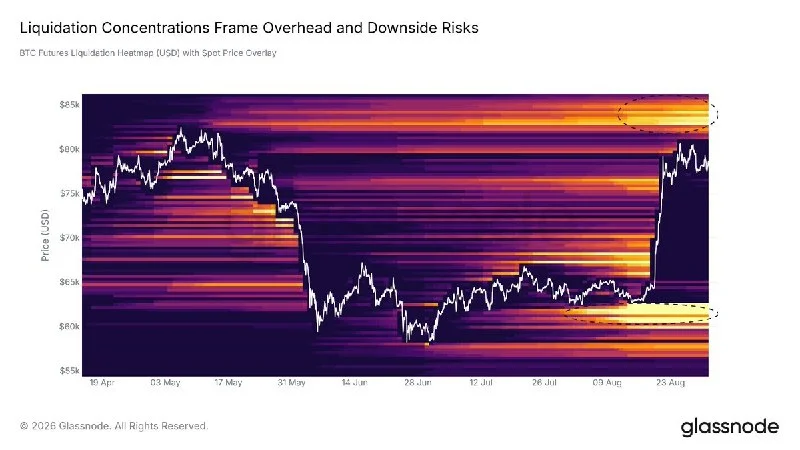
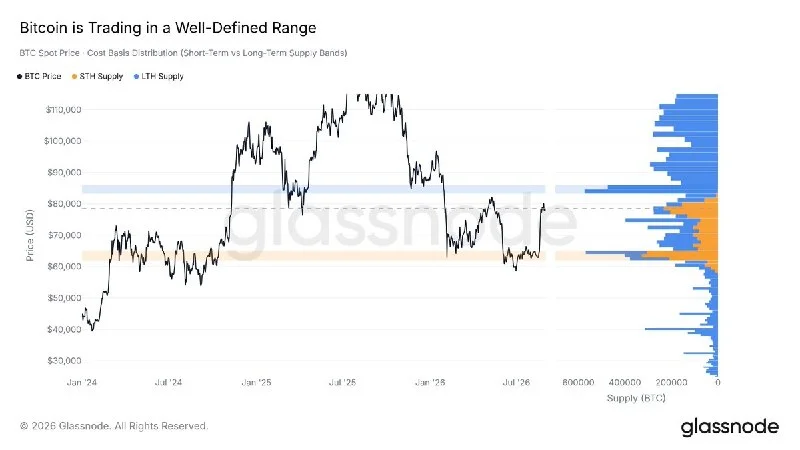
Bitcoin's on-chain supply levels align with liquidation clusters, while cost-basis bands match the leverage pain points.
That overlap gives traders a tighter map of the current range. The key signals to watch are whether price respects the cost-basis bands and whether liquidation activity builds around the identified clusters. This is a map of levels to monitor, not a stated directional forecast.

Frequently asked questions
-
How do cost-basis bands connect to the leverage pain points?
The bands line up with the identified leverage pain points, highlighting areas where leveraged positioning is under pressure.
-
What does the overlap add to the current trading range?
It gives traders a tighter map of the range by showing where Bitcoin supply levels, liquidation clusters and cost-basis bands converge.
-
What should traders watch around the identified clusters?
They should watch whether price respects the cost-basis bands and whether liquidation activity builds around the clusters.
-
Is the confluence a bullish or bearish signal by itself?
No directional call is stated. The confluence identifies levels to monitor rather than establishing a bullish or bearish outcome.
-
Why are liquidation clusters important for leveraged positions?
They mark areas where leverage can face pressure, especially when they overlap with supply levels and cost-basis bands.
 CoinDesk
 Lookonchain
 WuBlockchain
 CZ Binance
 Whale Alert