








 CoinDesk
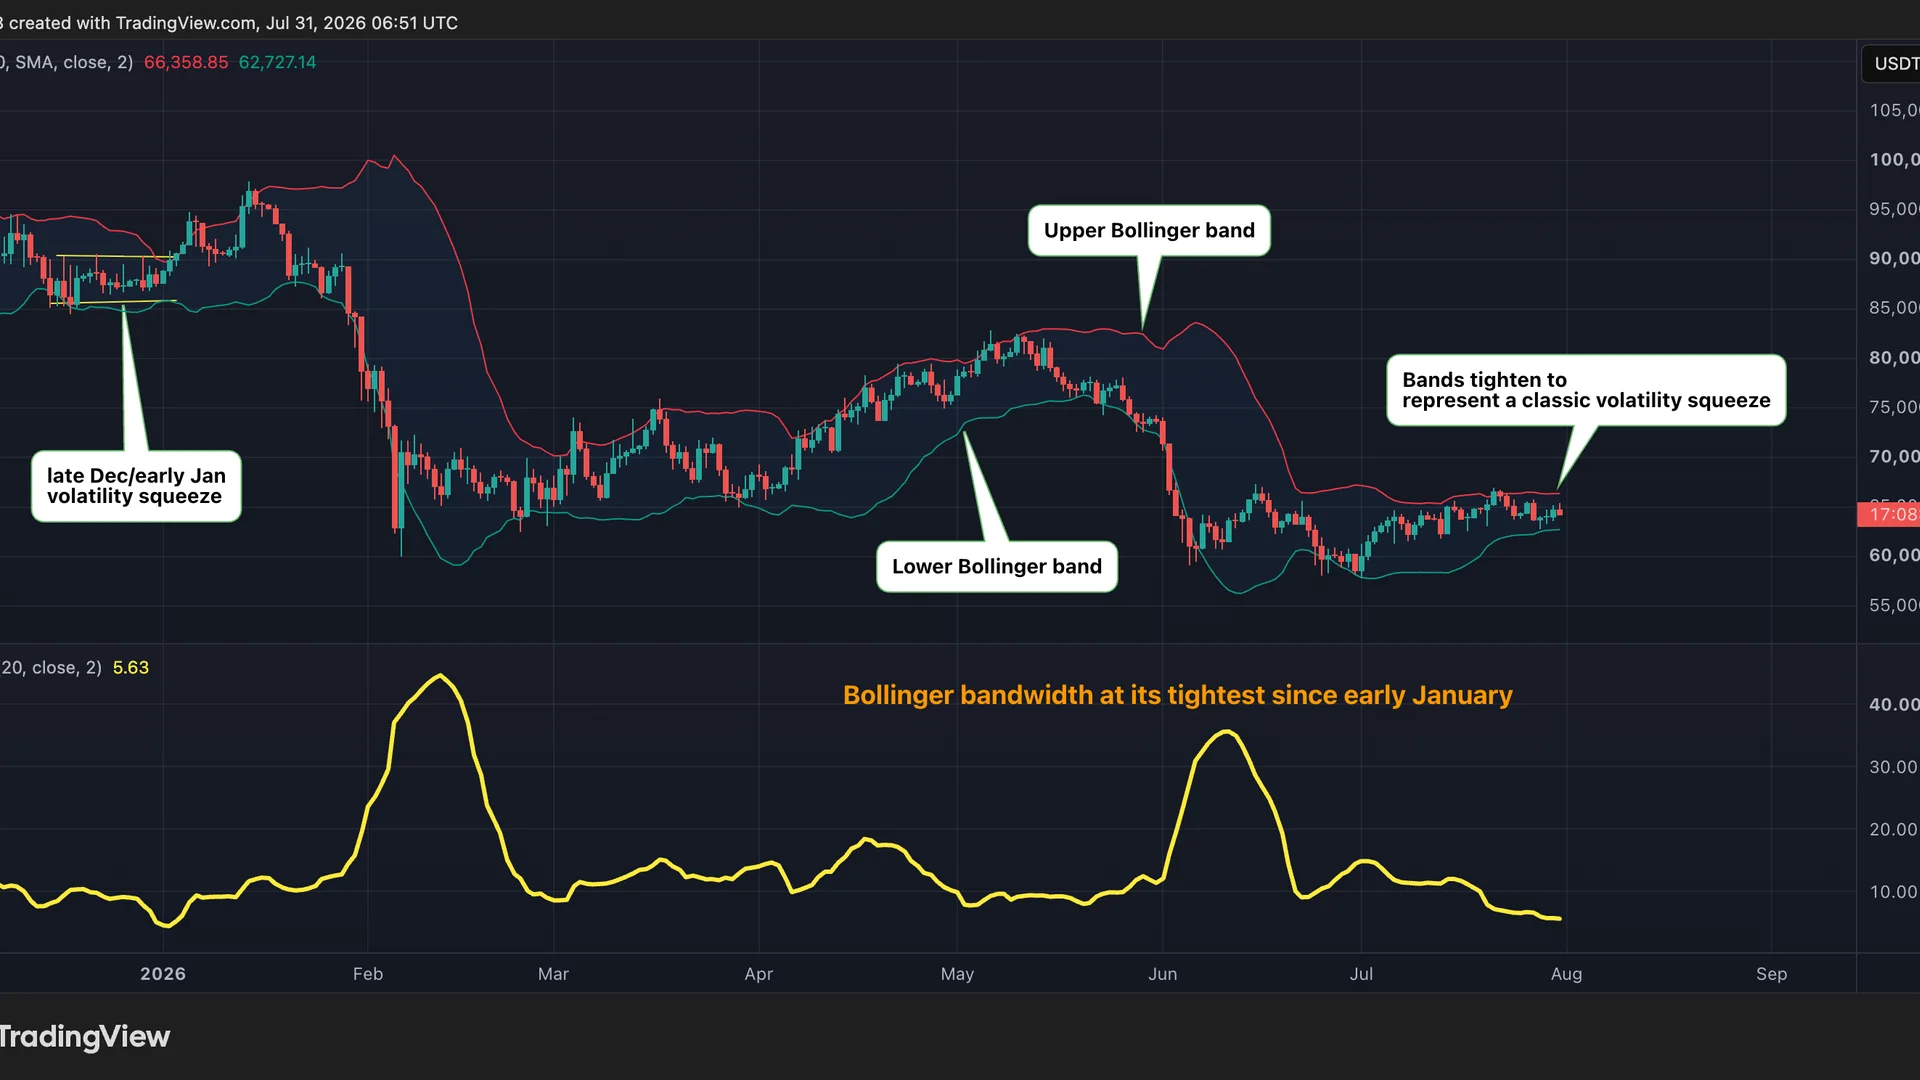



Bitcoin has settled into one of its quietest stretches since January, with daily price swings compressed into a narrow $62,000 to $65,000 band and trading volume on track for its lowest level since November 2023. Average daily volume has slipped to about $2.2 billion this month, down from roughly $5.1 billion during the December lull.
The technical signature of that compression is visible on the Bollinger bands. Bandwidth on the daily chart has tightened to its narrowest reading since the start of the year, with the indicator now sitting at 5.66 points. Two standard deviations above and below price are squeezing closer together as realized volatility grinds lower.
Why it matters
Tight Bollinger bands have a well-documented history in Bitcoin: the longer the squeeze holds, the more forceful the eventual breakout tends to be. The directional bias is never guaranteed, but the calm is rarely permanent. Past episodes, including the early-January band that held between $86,000 and $90,000, were followed by a swift expansion, first to nearly $98,000, then a slide toward $60,000 as volatility reasserted itself.
Market impact
Range traders are being forced to settle for tiny moves while momentum strategies dry up. The question for the next leg is whether the eventual unwind resolves up or down, and the coiled-spring setup means positioning into the breakout will carry asymmetric risk either way. Watch the upper and lower Bollinger rails; a decisive breach of either is the historical trigger for the next leg of $BTC price discovery.

Frequently asked questions
-
What is the current Bitcoin Bollinger bandwidth reading?
Bollinger bandwidth on Bitcoin's daily chart has tightened to 5.66 points, the narrowest reading since the start of the year, signaling a significant volatility squeeze.
-
What price range is Bitcoin stuck in right now?
Bitcoin has been largely confined to a $62,000 to $65,000 range, with daily swings compressed into one of the tightest bands since January.
-
How low has Bitcoin trading volume fallen?
Average daily Bitcoin trading volume has dropped to roughly $2.2 billion this month, on track for the lowest level since November 2023 and down from about $5.1 billion during the December lull.
-
Has a tight Bollinger band squeeze predicted Bitcoin moves before?
Yes. The January squeeze between $86,000 and $90,000 was followed by a sharp expansion, with Bitcoin rising to nearly $98,000 before sliding toward $60,000 as volatility reasserted itself.
-
What triggers the next big Bitcoin move from a squeeze?
A decisive breach of either the upper or lower Bollinger band rail has historically marked the start of the breakout, though the direction is never guaranteed in advance.
 CoinTelegraph
 Lookonchain
 Crypto News
 TheBlock
 WuBlockchain
 CryptoSlate