 CoinDesk

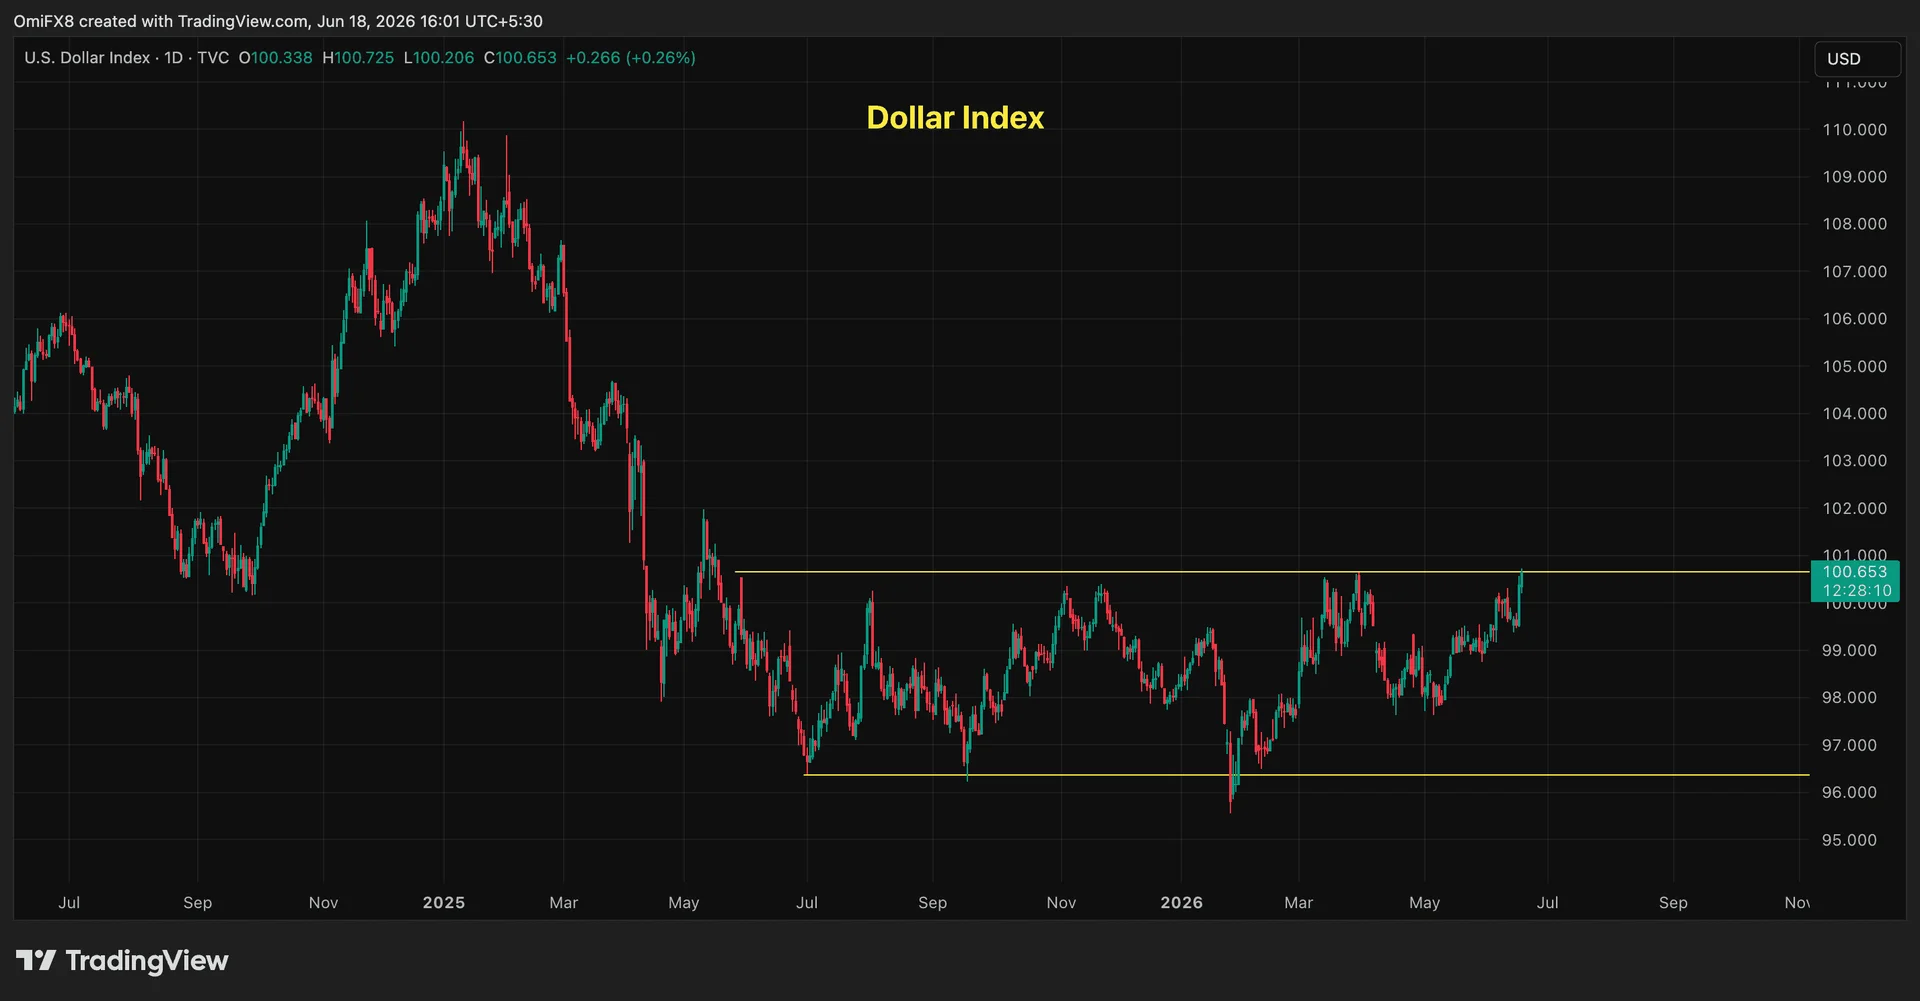


The Dollar Index climbed 0.26% to 100.66, extending Wednesday's 0.8% surge and pressing against the upper boundary of a 13-month trading range that has capped gains since May 2025. Bitcoin, trading near $63,900, fell almost 1% since midnight UTC, with broader majors posting similar losses and only scattered tokens — HASH, XLM, ENA — bucking the move with 7%-plus gains. The hawkish read from Wednesday's Fed decision is doing the lifting on the greenback, reviving fears that U.S. rates are biased higher.
Why it matters
The Dollar Index has spent more than a year consolidating below 100.60, a level where sellers have repeatedly overwhelmed buyers. A decisive break above that ceiling would convert a technical pattern into a regime signal — one that historically draws momentum chasers and extends dollar strength beyond the initial macro impulse. For BTC, the relevance is mechanical: the cryptocurrency's 90-day correlation coefficient with DXY sits at minus 0.82, an unusually tight inverse relationship that has held across multiple regimes.
Market impact
A confirmed DXY breakout would likely pull BTC toward the 200-week simple moving average at $62,258 — a level Kraken's economists note has historically delivered median returns above 100% over one- and three-year horizons following a dip below it. Other strategists, however, see a deeper selloff risk if that average gives way, with consensus expectations pinning BTC in a $60,000 to $70,000 range absent a fresh catalyst. With exchange volumes already sliding 3.45% in May to a nine-month low of $4.41 trillion, a dollar-driven leg down would land on a thinner market than the one that absorbed the spring rally.

Frequently asked questions
-
What is the Dollar Index (DXY) and why does it matter for Bitcoin?
The DXY tracks the U.S. dollar against a basket of major fiat currencies. Bitcoin's 90-day correlation with DXY is minus 0.82, meaning a stronger dollar tends to coincide with weaker BTC prices as risk assets and the greenback trade inversely.
-
What level is the DXY breaking out of and why is it significant?
The DXY is pressing against 100.60, the ceiling of a 13-month trading range that has capped dollar strength since May 2025. A decisive close above that level would convert a technical pattern into a regime signal and likely draw momentum buyers in.
-
Why is Bitcoin falling and what is the next key price level to watch?
Bitcoin slid nearly 1% to about $63,900 as the dollar strengthened following Wednesday's hawkish Fed decision. The next critical level is the 200-week simple moving average at $62,258 — a break below it could trigger deeper losses, while historical dips under that average have produced median returns above 100% over…
-
How did the Federal Reserve's latest decision impact crypto markets?
Wednesday's Fed decision struck a hawkish tone, raising concerns that U.S. interest rates may rise. The resulting dollar strength has weighed on BTC and other risk assets, with analysts framing the near-term trading range at $60,000 to $70,000 absent a fresh catalyst.
-
Are crypto exchange volumes supporting or worsening the price action?
Combined exchange volumes fell 3.45% in May to $4.41 trillion, the lowest level since September 2024. The thinner liquidity backdrop means any dollar-driven selloff would land on a quieter market than the one that absorbed the spring rally, amplifying potential downside moves.