








 CoinDesk
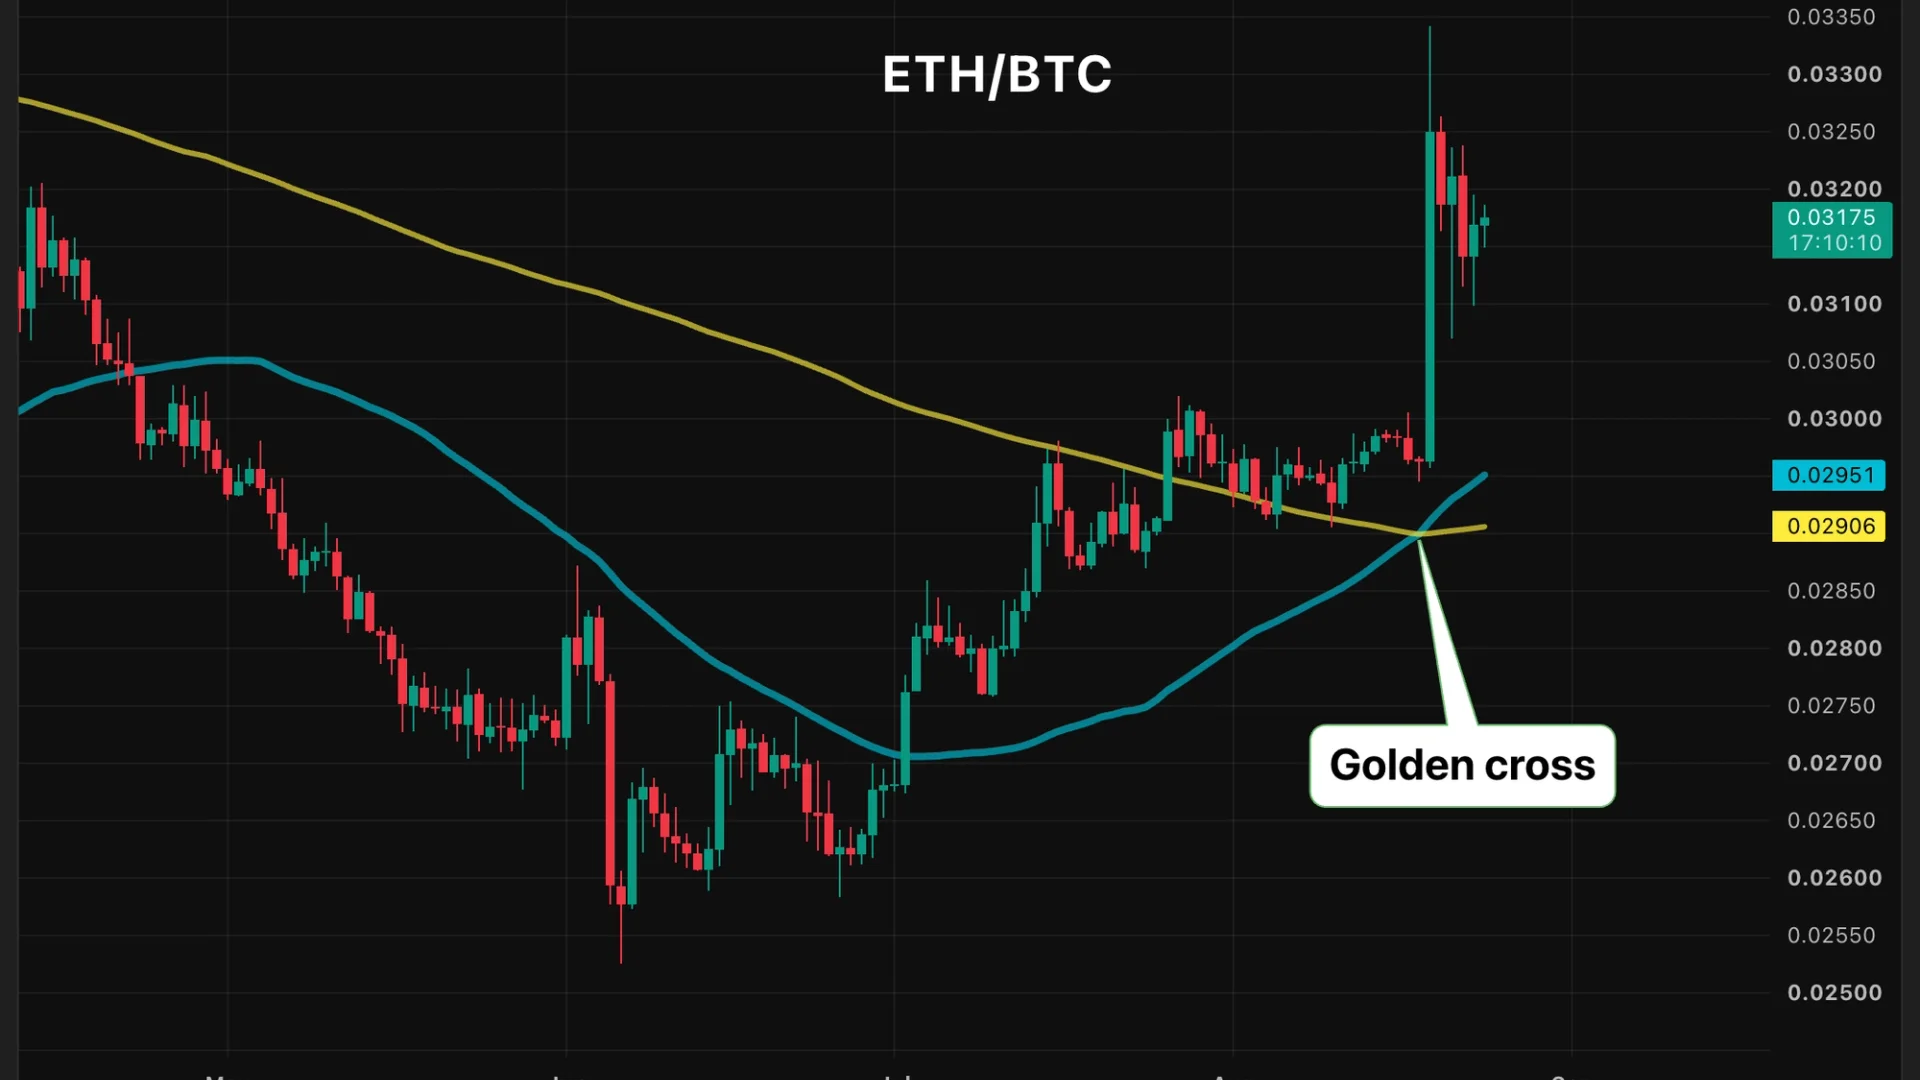


The ETH/BTC ratio has climbed 25% from its June 6 low, extending Ether's outperformance of Bitcoin since early June. The ratio's 50-day moving average has moved above its 200-day average, forming a bullish golden cross. The pattern signals that recent ETH/BTC momentum has overtaken the longer-term trend, but it is built from past price action rather than a forward-looking forecast.
Why it matters
This is a relative-strength signal, not just a call on crypto prices. A rising ETH/BTC ratio means Ether is gaining ground against Bitcoin, the market's benchmark asset. The crossover gives that rotation a clear technical marker after a 25% advance and raises the possibility of further ETH outperformance.
The record is mixed. The July 25, 2025 golden cross preceded a 36% rally over the next four weeks, but the ratio then reversed into a much steeper downtrend. The February 2021 cross powered a 93% rally that took the ratio to 0.0824 by mid-May 2021. Crosses in May and August 2022 became bull traps, with the ratio falling almost immediately.
Market impact
The immediate read favors ETH over BTC, while the pattern alone does not establish that a mega bull run has begun. The key test is whether the ETH/BTC ratio can extend and hold the move after the crossover instead of repeating the 2022 failures or the 2025 reversal.
For traders, the signal strengthens the case for watching market rotation into Ether, but confirmation matters more than the crossover itself. A sustained relative-strength move would validate the technical shift; an early reversal would reinforce the indicator's mixed record.


Frequently asked questions
-
What does a golden cross in the ETH/BTC ratio measure?
It occurs when the ratio's 50-day moving average rises above its 200-day average, showing that recent momentum has overtaken the longer-term trend.
-
How much has the ETH/BTC ratio risen since June 6?
The ratio has climbed 25% from its June 6 low, extending Ether's outperformance of Bitcoin since early June.
-
What happened after the July 25, 2025 crossover?
ETH/BTC rallied 36% over the following four weeks, then reversed into a much steeper downtrend.
-
How did the February 2021 golden cross compare?
It preceded a 93% rally that took the ETH/BTC ratio to 0.0824 by mid-May 2021.
-
Why is the current golden cross not a guarantee of a bull run?
Golden crosses are based on past price action, not a forward-looking forecast. The May and August 2022 crosses became bull traps as the ratio fell almost immediately.
 Crypto News
 WuBlockchain
 TheBlock
 CryptoSlate