








 CoinDesk
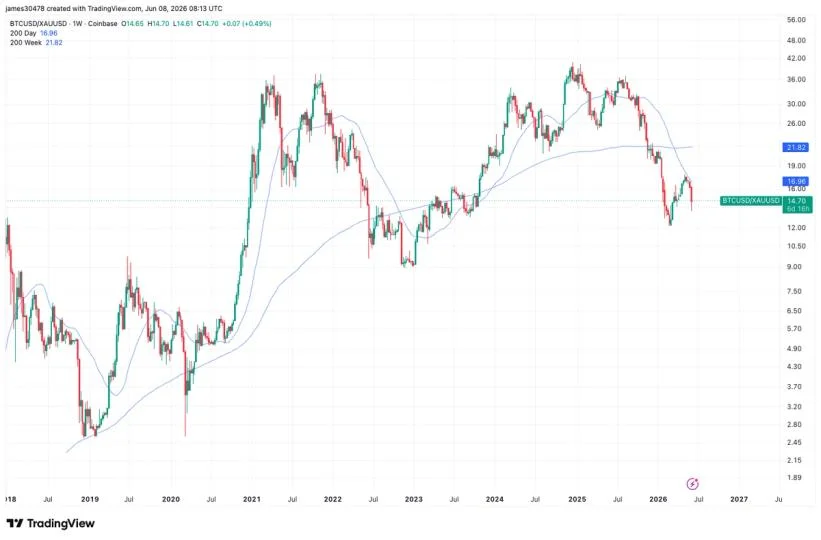
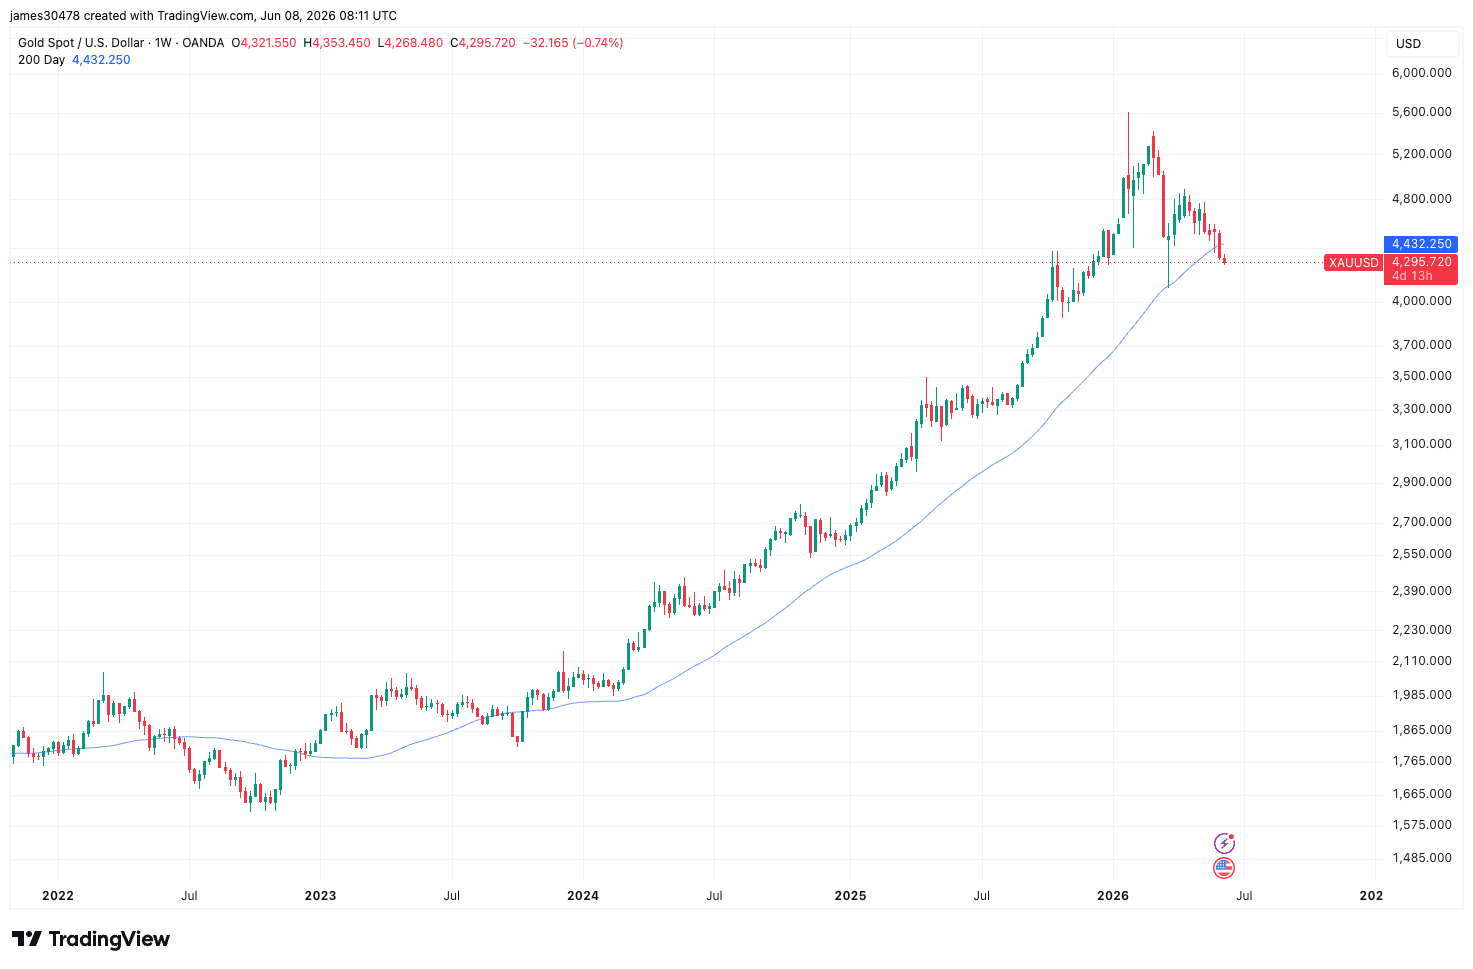


Gold has slipped below its 200-day moving average for the first time since October 2023, trading beneath $4,300 per ounce after falling more than 20% from its January record high of $5,600. The drop followed a stronger-than-expected U.S. jobs report that pushed the CME FedWatch Tool to price in a 25-basis-point December rate hike, lifting the federal funds rate target to a range of 3.75% to 4.00%.
The move handed a relative-strength signal to bitcoin: the bitcoin-to-gold ratio climbed 3% over the past 24 hours, a modest rebound from its February lows even though the ratio remains roughly 70% below its December 2024 peak of about 41 ounces. Last month's rejection of the same ratio at its own 200DMA preceded bitcoin's decline below $60,000, so the bounce carries technical weight on both sides of the pair.
Why it matters
The break below the 200DMA is a widely tracked long-term momentum signal, and the last time gold traded beneath it was October 2023 — months before its 200% rally to the January peak. Much of that advance was driven by the debasement trade: the thesis that government spending, rising debt levels, and loose monetary policy would erode fiat purchasing power and push investors into scarce stores of value. A confirmed trend reversal in gold therefore removes one of the macro narratives that had been diverting safe-haven flows away from bitcoin.
Compounding the pressure on risk assets, the US Dollar Index (DXY) has climbed back above 100, tightening global financial conditions and making dollar-denominated assets more expensive for international buyers. Silver, gold's higher-beta cousin, is now testing support at its own 200DMA near $67 per ounce, suggesting the metal complex is weakening in tandem rather than gold diverging on an idiosyncratic shock.
Market impact
A stronger dollar and a higher-for-longer Fed path are textbook headwinds for both gold and bitcoin, but the relative trade tells a different story.

Frequently asked questions
-
Why is gold dropping and what does it mean for bitcoin?
Gold fell below its 200-day moving average after a stronger US jobs report pushed markets to price a December Fed rate hike, with the DXY back above 100. The bitcoin-to-gold ratio rising 3% in a day suggests capital is rotating between scarce assets rather than fleeing outright.
-
What is the bitcoin-to-gold ratio and why does it matter?
The BTC-to-gold ratio measures how many ounces of gold one bitcoin can buy. It climbed 3% over the past 24 hours but remains roughly 70% below its December 2024 peak of about 41 ounces, so the bounce is modest relative strength, not a confirmed breakout.
-
What triggered the latest sell-off in gold?
A stronger-than-expected US jobs report on Friday pushed the CME FedWatch Tool to price a 25-basis-point December rate hike, lifting the fed funds target to 3.75%–4.00%. The DXY's move back above 100 has tightened global financial conditions, weighing on commodities and crypto.
-
Is a break below the 200-day moving average bearish for gold?
A break below the 200DMA is widely read as a sign that long-term bullish momentum has weakened and a broader trend reversal may be underway. This is the first time gold has traded below its 200DMA since October 2023.
-
What would confirm a bullish turn for bitcoin against gold?
The bitcoin-to-gold ratio would need to reclaim its own 200DMA, which it was rejected from in October. Until that happens, the 3% daily move is a glimmer of resilience rather than a confirmed regime shift.
 CoinTelegraph
 CryptoSlate
 TheBlock
 Crypto News
 WatcherGuru