








 CoinDesk
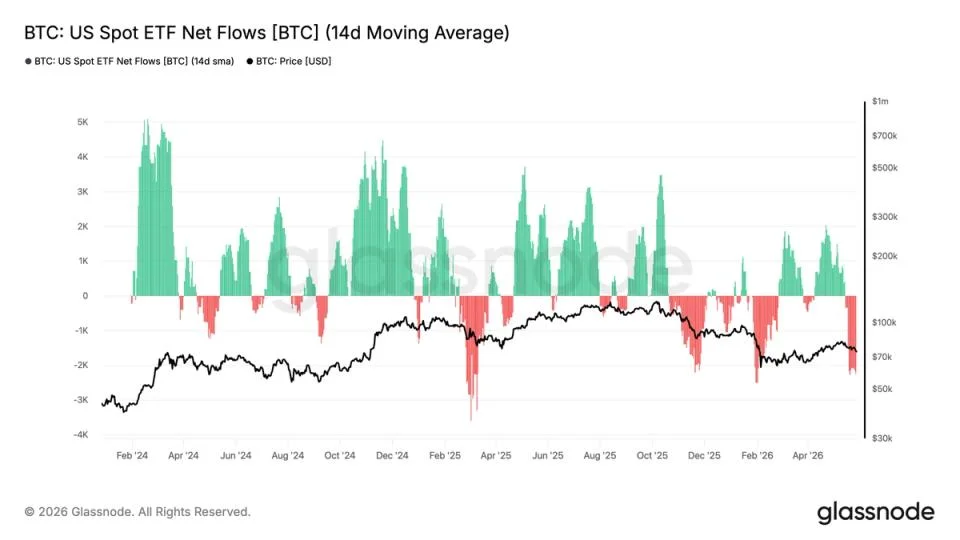


U.S. spot bitcoin ETFs have now recorded nine consecutive trading days of net outflows — the longest withdrawal streak since the products listed in January 2024, according to SoSoValue data. Over the nine-session run, investors pulled roughly $2.8 billion from the funds, surpassing any previous period of sustained selling pressure and pushing weekly redemptions to approximately $1.3 billion. Monthly withdrawals now stand at roughly $2.3 billion across the complex.
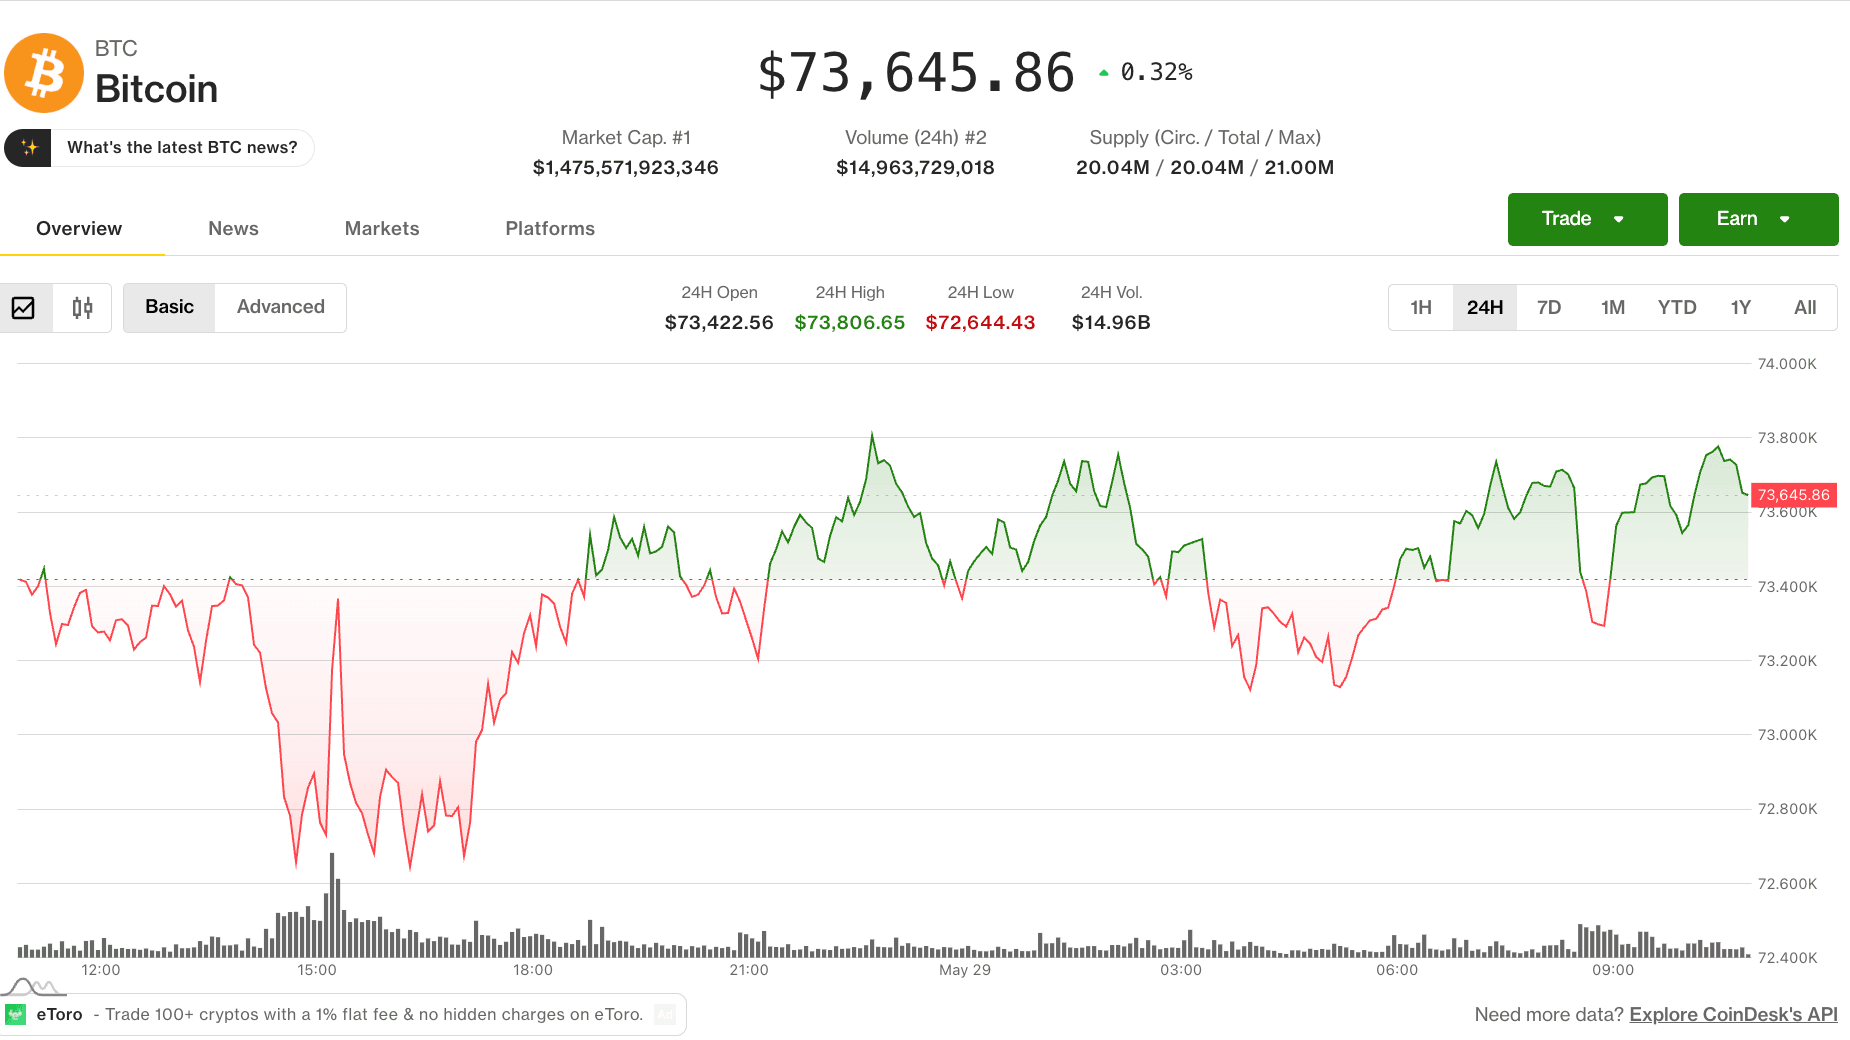
The outflows have coincided with a sharp slide in BTC, which has fallen from roughly $80,000 to $73,000 over the period. But the broader backdrop extends beyond bitcoin's own price action: since the start of the year, BTC has lagged the market's best-performing assets, particularly AI-related equities, semiconductor and memory-chip stocks that have continued to attract capital amid enthusiasm around AI infrastructure spending.
Why it matters
Signs of institutional selling have surfaced beneath the headline flow data. BlackRock's iShares Bitcoin Trust (IBIT) recorded its largest single-day outflow since launch earlier this week, driven largely by a sizeable dark pool transaction. While the precise motivation behind the trade is unknown, the scale of the redemption suggests some investors may be reallocating capital away from BTC exposure and toward sectors that have recently generated stronger returns. A single dark-pool print clearing that aggressively points to a desk-level rebalance rather than retail noise.
Market impact
Sustained ETF outflows have often historically coincided with periods of market stress that later developed into local bottoms. Glassnode's 14-day moving average of ETF flows tends to trough near significant turning points — a pattern that emerged during the early February correction toward $60,000, and again in November around the post-all-time-high pullback near $85,000. The derivatives tape is sending a mixed signal: implied volatility has compressed to its lowest since September, suggesting traders expect near-term calm, yet one-week put-call skew has crept higher as demand for downside protection quietly builds.

Frequently asked questions
-
How much have spot bitcoin ETFs lost in the nine-day outflow streak?
U.S. spot bitcoin ETFs have shed roughly $2.8 billion over nine consecutive trading sessions, with approximately $1.3 billion exiting this week alone, according to SoSoValue data. Monthly withdrawals across the complex now sit near $2.3 billion.
-
Why are bitcoin ETFs bleeding right now?
Investors appear to be reallocating capital away from BTC exposure and into sectors with stronger recent returns — particularly AI-related equities, semiconductor and memory-chip stocks that have benefited from enthusiasm around AI infrastructure spending.
-
Did BlackRock's IBIT see unusually large outflows?
Yes. IBIT recorded its largest single-day outflow since launch earlier this week, driven largely by a sizeable dark pool transaction. The scale of the redemption points to a desk-level rebalance rather than retail selling.
-
Have long ETF outflow streaks historically marked bitcoin bottoms?
Sustained periods of ETF selling have often coincided with market stress that later developed into local bottoms. Glassnode's 14-day moving average of ETF flows tends to trough near significant turning points, a pattern that showed up in the early February correction toward $60,000 and again in November around $85,000.
-
What are derivatives markets signaling about the next move?
The tape is split. Implied volatility has compressed to its lowest since September, suggesting traders expect near-term calm, but one-week put-call skew has crept higher as demand for downside protection quietly builds. BTC's rejection above $83,000 has compounded a pattern of lower highs stretching back to October.
 WuBlockchain
 Glassnode
 CryptoSlate
 Altcoin Daily
 TheBlock
 Crypto News