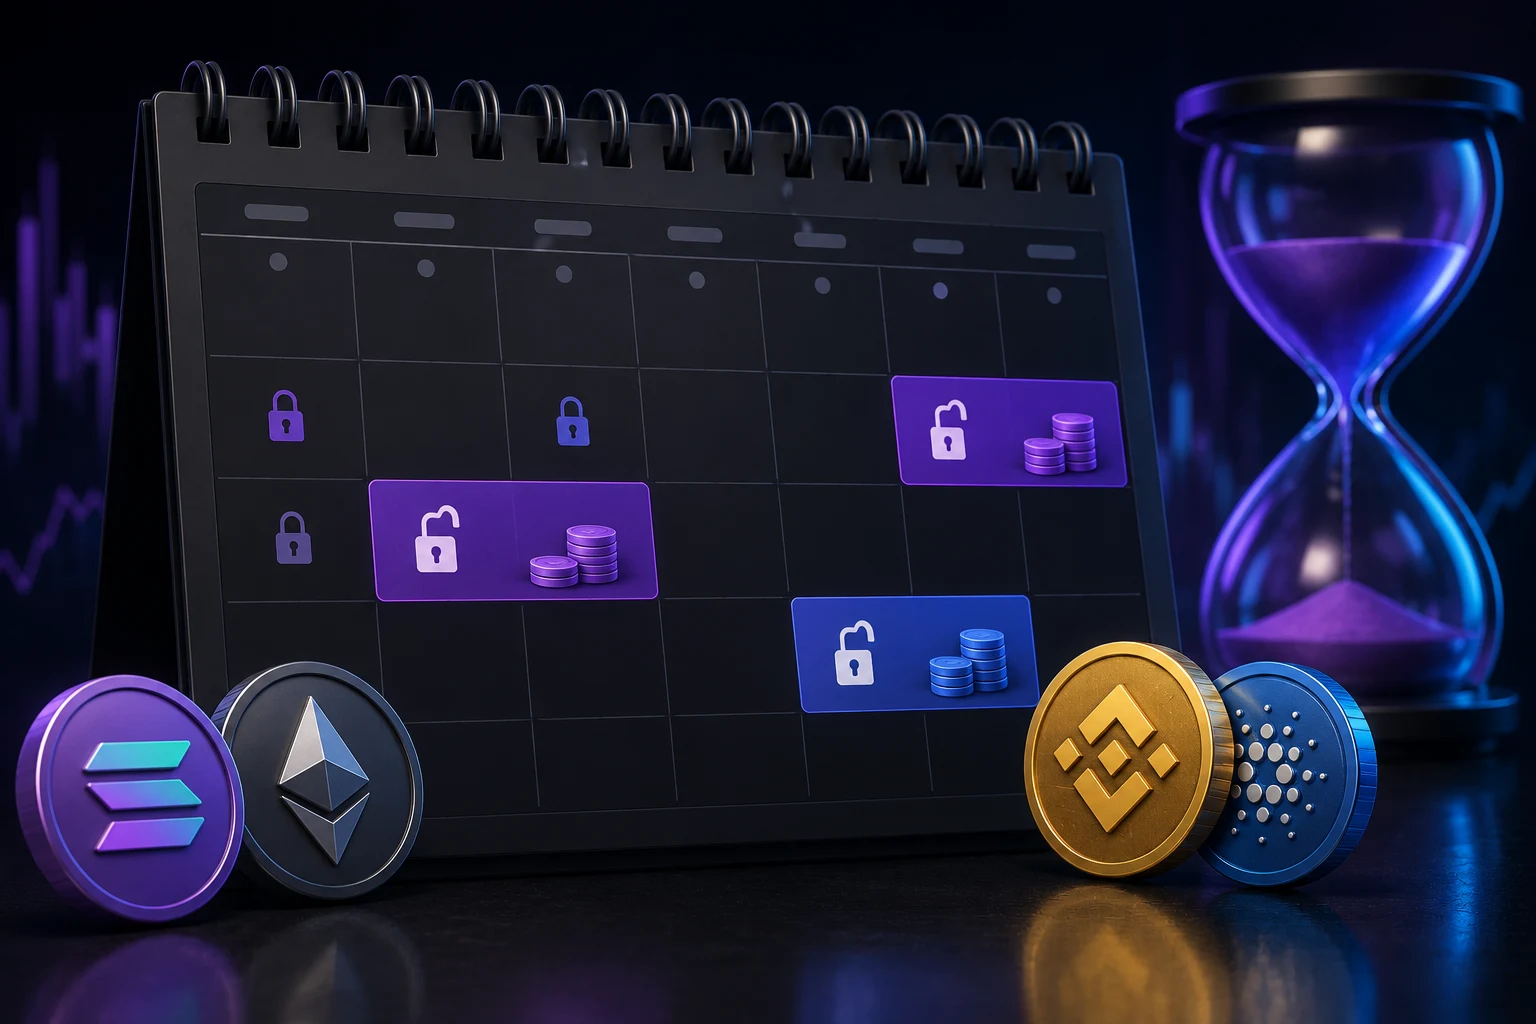
What a token unlock actually is
When a crypto project raises money from investors or pays its team in tokens, those tokens usually cannot be sold right away. The project puts them on a vesting schedule, which is a written timeline saying when each batch becomes transferable. An unlock is the moment a batch crosses from "locked" to "unlocked."
This distinction matters because almost every news headline gets it wrong. "Project X has a $40 million unlock this Friday" sounds like $40 million of tokens are about to hit the order book. In reality, the unlock only makes those tokens eligible to move. Whether they actually move, where they move to, and how fast they are sold is a separate question that depends on the recipients, the project rules, and the market mood.
The mental model worth keeping is this: vesting converts promises into optionality. A cliff unlock gives a recipient a one-time choice to sell, hold, stake, or transfer. A linear vesting drip gives them that choice in small pieces every day. The price impact is mostly driven by what choice they make, not by the size of the unlock on paper.
Cliff, linear, and vesting structures
Unlock calendars use three main schedule types, and confusing them is the single biggest reason beginners misread the data.
A cliff is a single large unlock after a set delay. Imagine a 12 month cliff followed by a 24 month linear drip. After one year, 10 or 20 percent of the allocation becomes available all at once, then the rest trickles out monthly. Cliffs are the dates traders watch most closely because they create concentrated supply shocks. The "cliff vs linear vs vesting" distinction is essentially the difference between a flood and a slow leak.
Linear vesting releases a fixed slice every block, day, or month. If an investor's allocation is 1.2 million tokens over 24 months, they receive 50,000 tokens per month, continuously. Linear schedules are easier for the market to digest because the daily additions are small and predictable. Most well-run projects use linear vesting for team and advisor tokens precisely so there is no single cliff date where insiders can dump on retail.
Hybrid schedules combine both. A small cliff after a seed round, then a long linear tail. Some unlocks also have cliffs without linear tails, which is the worst case for holders because the entire allocation unlocks at once and never drips again. When you read a calendar, identify which type you are looking at before you do any math. A $20 million cliff unlock in one week is a fundamentally different event than $20 million spread linearly across the next year.
Float versus FDV: the math that actually matters
Headlines love raw dollar amounts, and raw dollar amounts are mostly noise. Two unlocks can both be "$50 million," and one can be a non-event while the other halves the token. The reason is float versus fully diluted valuation (FDV).
Float is the number of tokens actively trading on the open market right now. FDV is the hypothetical value if every token that will ever exist, including locked ones, were circulating at today's price. A token with 100 million total supply, 20 million in float, and a $1 price has a $20 million market cap and a $100 million FDV. If a $10 million cliff unlock happens and all of it sells, the float doubles, but the FDV only rises by 10 percent. The price reaction depends on which number changes.
What you really want is the float percentage of the unlock. If a 5 percent cliff unlock lands on a token with 80 percent of supply already circulating, the market can absorb it easily. If a 5 percent cliff unlock lands on a token where only 15 percent of supply is in float, the float triples overnight, which is a serious shock. Always do the division: unlock size divided by current circulating supply.
The same logic applies to FDV. A token with a $50 million float and a $5 billion FDV is structurally weak because every future unlock increases the float that FDV assumes is already there. When the FDV is wildly higher than the market cap, almost any unlock is bad news. When they are close, unlocks barely matter.
Why "unlock day" is rarely the dump
Here is the part that surprises most readers. Look at historical data on big unlocks, and a clear pattern emerges: the actual price drawdown often starts weeks before the listed unlock date and finishes weeks after. The unlock itself is usually mid-range or even irrelevant on the day.
Two mechanisms drive this. First, sophisticated holders front-run the unlock. Venture funds and early backers know their cliff is coming, and many rotate out of the position 4 to 6 weeks in advance to avoid selling into a known supply event. You see this as a slow drift down on the chart, not a single candle on unlock day.
Second, OTC desks absorb the supply quietly. Large unlock recipients often do not sell on the open market at all. Instead, they negotiate over-the-counter trades with funds or market makers, which clears the supply with minimal price impact. By the time the calendar shows the unlock as "live," the tokens have already changed hands privately.
The third mechanism is just plain delay. Recipients may be locked by their own fund rules, by token transfer restrictions, or by staking incentives. They receive the tokens but cannot or choose not to sell for a while. The Solana ecosystem in 2023 and 2024 was a real-world example: several large unlocks hit the calendar but the supply never reached exchanges because the recipients staked or held.
Risk factors that change everything
Reading a calendar without looking at context is how traders get burned. The same unlock size can be catastrophic for one token and irrelevant for another, depending on a handful of risk factors that should sit high in your analysis.
The first is who is receiving the unlock. Team and advisor unlocks are higher risk than ecosystem or treasury unlocks because insiders have less reason to hold. Treasury unlocks often get used for grants, liquidity, or buybacks, not for personal profit-taking. Ecosystem unlocks go to user incentives, which usually means the tokens stay deployed somewhere.
The second is the token's market depth. A $2 million daily volume token can absorb a $200,000 unlock without blinking. A $50 million daily volume token can absorb a $20 million cliff because there are enough counterparties. Thin order books turn routine unlocks into wicks. You can check market depth on the order book or by looking at average daily volume versus the unlock size.
The third is whether the project has a buyback-and-burn program. Some protocols use treasury or protocol revenue to buy their own token on the open market and burn it, which permanently removes supply. If a project buys back $5 million of its own token in the same week as a $5 million unlock, the net change in float is zero. This is why the same headline can mean nothing for one token and doom for another.
The fourth is staking and lockup incentives. Many unlocks land in wallets that immediately restake the tokens for yield. If the staking APY is attractive and the lockup penalty for early withdrawal is real, recipients have a reason to hold instead of sell. Conversely, if staking yields collapse before the unlock, the same tokens that were going to be held suddenly become sellable at any price.
The fifth is emission rate versus absolute size. This is the trap that catches most beginners. A project might "only" unlock 1 percent of supply per month, but if it has a high inflation rate from other sources like staking rewards, the real emission rate is much higher than the unlock calendar suggests. Always combine unlock data with tokenomics emission charts.
How to actually model the impact
Once you have the schedule and the context, you can build a rough mental model for impact. Start with three numbers: the unlock size in tokens, the current circulating supply, and the average daily volume on major exchanges. Divide the unlock by the daily volume. If the result is over 30 percent, expect serious volatility. Under 5 percent, expect almost nothing on the day itself.
Next, check the float percentage. If the unlock is more than 5 percent of the float, treat it as a major event regardless of dollar size. If it is under 1 percent, treat it as background noise. Most calendars show this for you if you scroll past the headline number.
Then look at the historical pattern of this specific project's unlocks. The first time a team unlock hits, behavior is uncertain. The third or fourth time, recipients have established patterns: do they sell the entire tranche, do they sell 20 percent and stake the rest, do they route through OTC? Past unlocks are the strongest predictor of future unlocks.
Finally, overlay the macro context. A cliff unlock landing during a bull market with rising volume gets absorbed easily. The same unlock landing during a fear-driven market with shrinking volume gets magnified. The unlock calendar is one input among many, not a standalone trading signal.
Tools, sources, and what to ignore
The main public sources for unlock data are Token Unlocks, CryptoRank, and Messari. Each shows scheduled cliffs, linear drips, and the percentage of total supply. CoinGecko and CoinMarketCap now embed unlock information on token pages too. For deeper due diligence, read the project's own tokenomics documentation and look for a vesting schedule graphic in the original raise documents.
Most unlock trackers are accurate on dates but sloppy on details. They often do not tell you whether an unlocked tranche can actually be sold. Some projects impose transfer restrictions, multi-sig delays, or staking lockups that the calendar ignores. Always cross-reference the schedule with the project's governance forum or tokenomics paper before sizing a position around it.
What to ignore: hype on social media about "upcoming dumps," price targets attached to specific dates, and any analysis that does not show the math. If someone claims a token will crash because of an unlock but cannot tell you the float percentage, the daily volume, or the recipient breakdown, ignore them. Unlock analysis is mostly arithmetic, and bad arithmetic makes bad calls.
Stay ahead of token unlocks the smart way
Unlocks move markets in ways that are easy to misread if you only see the headlines. The signals that matter are floating supply, vesting structure, recipient behavior, and live market depth, all of which change constantly as projects evolve. Tracking all of that by hand is a losing game, especially when several unlocks are queued up for the same week. Zippfeed surfaces crypto token unlock headlines alongside broader market news, with sentiment scoring (bullish, neutral, or bearish) and an importance rating, so you can spot supply pressure events before the chart shows you the damage.