 CoinDesk
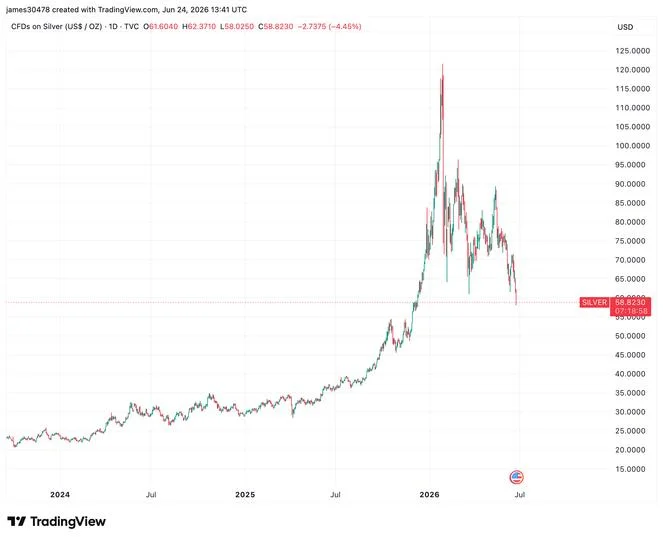


Gold, silver and bitcoin are all selling off sharply as the dominant 2025 macro trade, the bet that persistent fiscal deficits and runaway government debt would erode fiat purchasing power, unwinds on renewed fears of tighter monetary policy. Gold has dropped roughly 28% from its January 2025 peak of $5,600 per ounce and now trades below $4,000, while silver has lost more than 50% from a record high near $120, slipping beneath $59 on Wednesday. Bitcoin has not been spared: the cryptocurrency now sits below $62,000, a 50% correction from its October all-time high and a print under its 200-week moving average near $62,800.
Why it matters
The reversal marks the most violent unwind of the so-called debasement trade since it took hold. Markets are now pricing in two 25 basis point rate hikes by March 2027 under new Federal Reserve Chair Kevin Warsh, which would lift the federal funds rate to 4.00%-4.25% on renewed inflation fears. That is a direct repudiation of the 2025 thesis that real assets would outperform as fiat credibility eroded. Bitcoin had already been the laggard of the three for most of last year, hovering around the $100,000 level while gold and silver ripped higher, which prompted investors to question whether BTC still belonged in the debasement basket at all. The current synchronized drawdown suggests the answer is yes, just not in the direction bulls wanted: when real rates rise, every inflation-hedge bucket gets sold.
Market impact
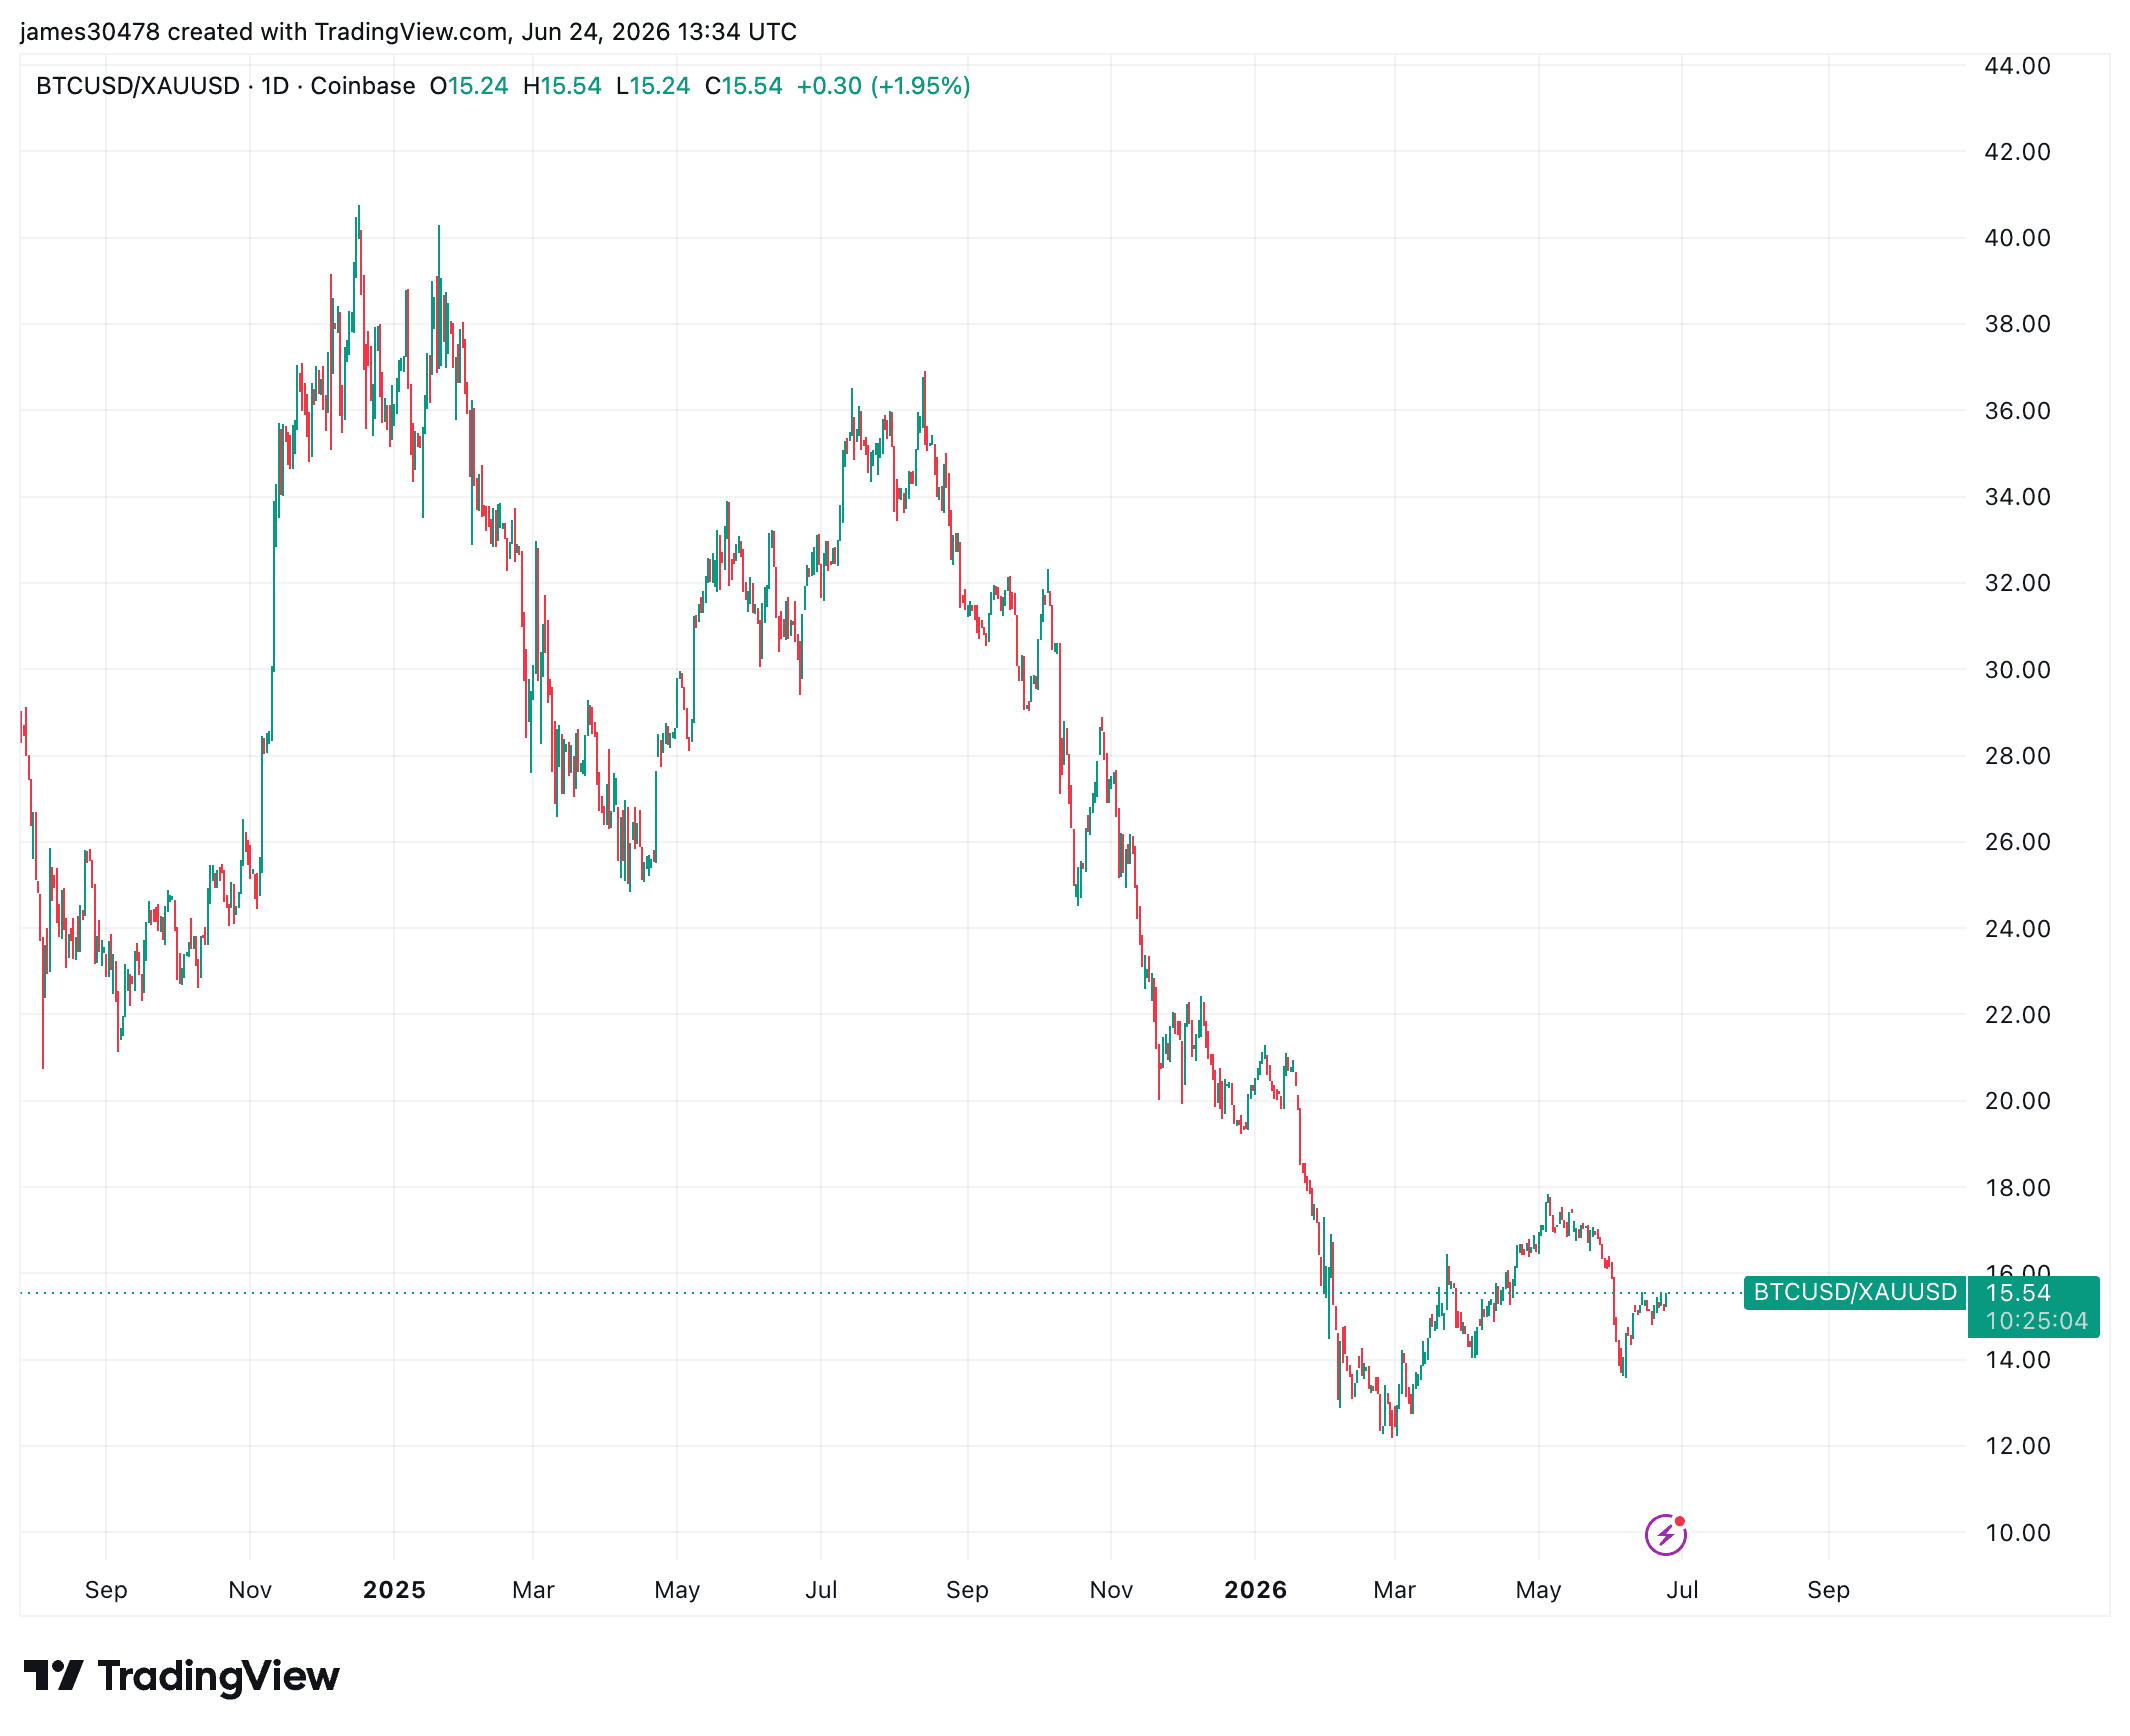
Bitcoin has actually outperformed the metals in relative terms since the ratios bottomed in February, gaining roughly 30% against gold and 55% against silver. That is a thin silver lining: all three assets continue to lag U.S. equities in 2026, where momentum remains concentrated in semiconductor and memory-related names. With BTC now trading below its 200-week moving average, the technical damage is real, and the macro tailwind that was supposed to lift the asset has flipped into a headwind. The watch item is whether Warsh's Fed delivers the priced-in hikes or walks them back; the debasement trade will not reassert until real yields roll over.

Frequently asked questions
-
How much have gold and silver fallen from their 2025 highs?
Gold has dropped roughly 28% from its January 2025 peak of $5,600 per ounce and trades below $4,000. Silver has lost more than 50% from a record high near $120, slipping under $59 on Wednesday.
-
What is driving the synchronized sell-off in bitcoin, gold and silver?
Markets are repricing for tighter monetary policy under new Federal Reserve Chair Kevin Warsh, pricing in two 25 basis point rate hikes by March 2027 that would lift the federal funds rate to 4.00%-4.25% on renewed inflation fears.
-
What is the debasement trade and why is it unwinding?
The debasement trade was the 2025 bet that persistent fiscal deficits and rising government debt would erode fiat purchasing power, lifting real assets like gold, silver and bitcoin. It is unwinding because the Fed is now expected to hike rather than hold, which strengthens real yields and pulls capital out of…
-
How has bitcoin performed against gold and silver during the correction?
Bitcoin has actually outperformed both metals in relative terms since the ratios bottomed in February, gaining roughly 30% against gold and more than 55% against silver, even as all three assets lag U.S. equities in 2026.
-
Why is bitcoin trading below its 200-week moving average a concern?
BTC is now below $62,000, a 50% correction from its October all-time high, and under its long-term 200-week moving average near $62,800. A sustained print under that level is a classic technical damage signal that long-term trend followers watch closely.