








 CoinDesk
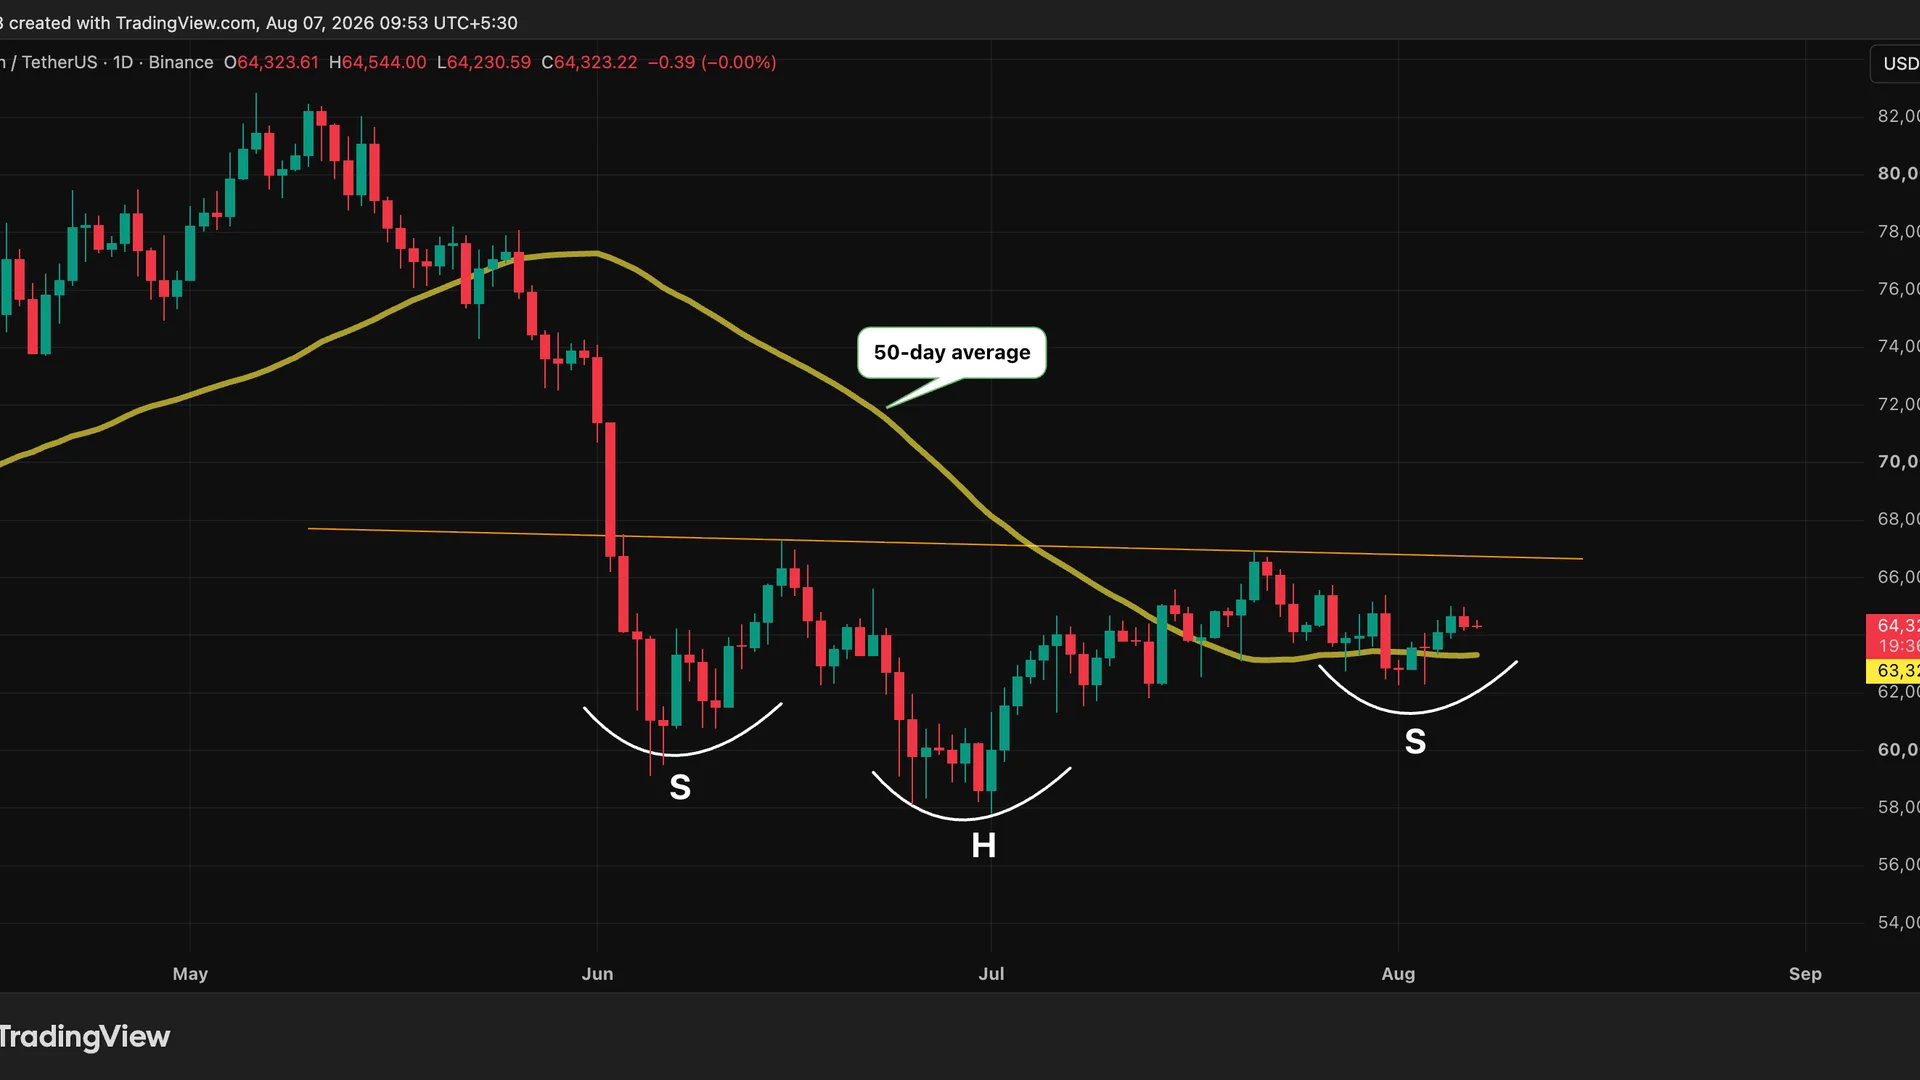



Bitcoin is tracing a potential inverse head-and-shoulders pattern on the daily chart, with a neckline near $66,800 and a projected target around $76,000 if price breaks and holds above it. The formation is not confirmed, and the 50-day simple moving average near $63,321 is the first downside level to watch. The left shoulder formed near $60,000 in early June, the head near $57,700 in late June or early July, and the right shoulder followed a bounce from around $62,500.
Why it matters
An inverse head-and-shoulders has three troughs separated by rebounds, with the middle trough marking the deepest selling. Here, the bounce highs sit near a common resistance zone, creating the neckline. A decisive break above $66,800 would confirm the setup for chartists; without it, the formation remains a possible path rather than a completed reversal.
Technical analysis remains subjective, and some chartists may not view the formation as textbook. Thomas Bulkowski's research ranks the inverse H&S 13th among 39 chart patterns, with an 11% break-even failure rate. His data found that 71% met their measured target, while 65% first pulled back to retest the neckline.
Market impact
The bullish case depends on price action at the neckline, not the visual pattern alone. A decisive break above $66,800 would put the measured move toward $76,000 in focus, while a failure to clear the level would leave the signal unconfirmed.
Fading odds of the Clarity Act passing this year remove a regulatory catalyst some traders had counted on. A decisive break below the 50-day average near $63,321 would show that Bitcoin's setup is losing footing.

Frequently asked questions
-
How is the projected $76,000 target calculated?
The target comes from adding the distance between the roughly $66,800 neckline and the near-$57,700 head back above the breakout level, producing a projection near $76,000.
-
What do the three troughs represent on Bitcoin's chart?
They are the left shoulder near $60,000, the deeper head near $57,700, and the right shoulder after a bounce from around $62,500.
-
Which downside level would weaken Bitcoin's bullish setup?
A decisive break below the 50-day simple moving average near $63,321 would be an early sign that the formation is losing footing.
-
Why does the Clarity Act matter to Bitcoin's bullish case?
Dwindling odds of the Clarity Act passing this year remove a regulatory catalyst some traders had counted on, creating a headwind for the bullish setup.
-
How reliable is an inverse H&S pattern historically?
Thomas Bulkowski's research ranks inverse H&S 13th among 39 chart patterns, with an 11% break-even failure rate. It found 71% met their measured target and 65% first retested the neckline.
 Lookonchain
 WatcherGuru
 Crypto Capital Venture
 CoinTelegraph
 TheBlock
 Crypto News