








 CoinDesk
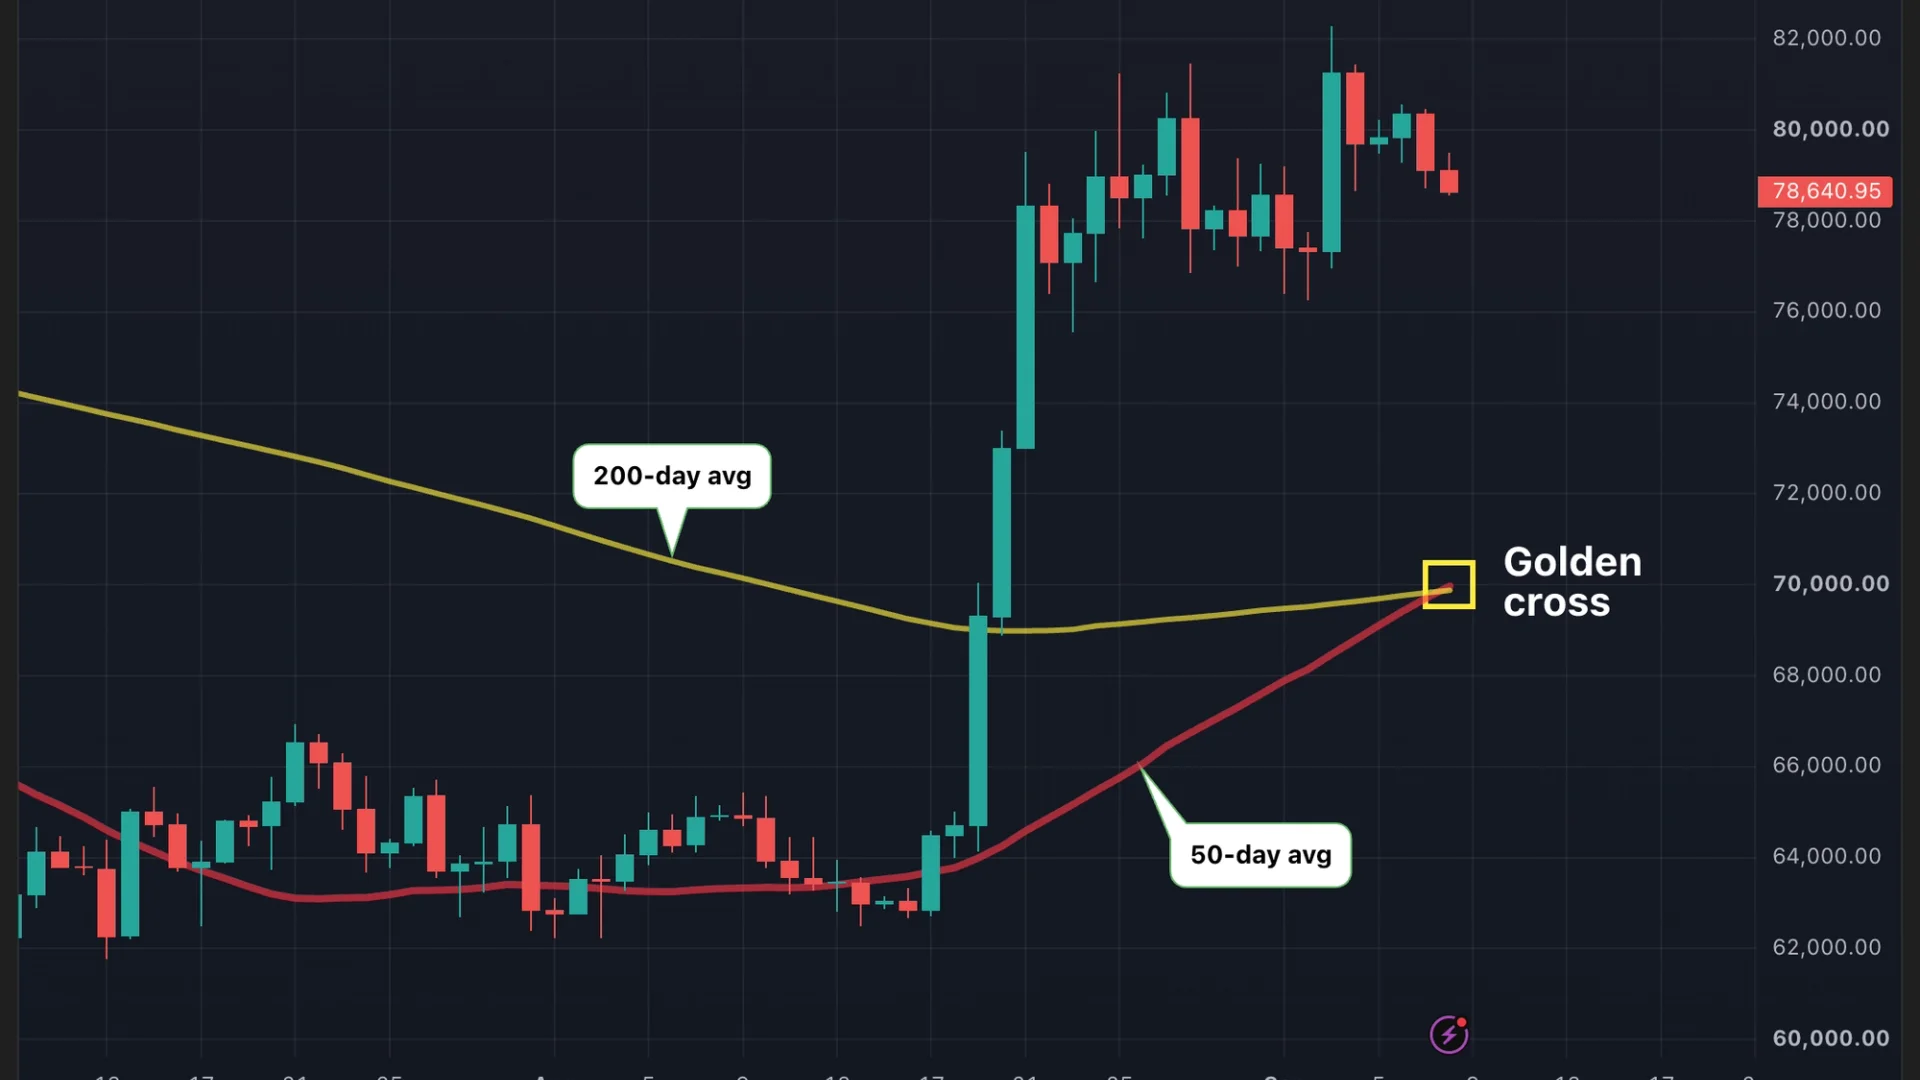


Bitcoin's 50-day simple moving average crossed above its 200-day average on the daily chart, triggering the widely watched golden cross at a price of $78,650. The crossover signals short-term momentum overtaking the long-term trend, a setup technicians read as the start of a sustained rally. Bitcoin was down 0.6% since midnight UTC at the moment the signal fired.
Why it matters
The golden cross has flashed 12 times in Bitcoin's history, and the historical record is more mixed than the celebratory framing suggests. Only three of those crosses held for a full year, generating an average return of 250% over the following twelve months. Across the other nine measurable instances, the three-month average gain was a far more modest 24.9%. The signal has triggered premature bull traps three times as often as it has produced sustained multi-year rallies.
Market impact
The asymmetry is the read here: the golden cross is real, but the historical bull-trap rate runs higher than the breakout rate on the prior sample. A 24.9% average three-month return on the broader cohort is still meaningful for a long-biased trader, and a 250% twelve-month return on the rare sustained cases is the kind of payoff that keeps chart-watchers watching. With the cross freshly printed at $78,650, the next several weeks of price action will determine whether this one joins the three that ran or the nine that faded.

Frequently asked questions
-
What is a Bitcoin golden cross?
It occurs when Bitcoin's 50-day simple moving average crosses above its 200-day simple moving average on the daily chart, signaling that short-term momentum has overtaken the long-term trend.
-
How many times has Bitcoin's golden cross triggered in history?
The signal has flashed 12 times in Bitcoin's history, based on CoinDesk's review of historical price data.
-
What has Bitcoin's average return been after a golden cross?
On the three crosses that held a full year, the average 12-month return was 250%. Across the other nine measurable instances, the average three-month gain was 24.9%.
-
Has the golden cross been a reliable indicator for Bitcoin?
The track record is mixed. Only three of twelve historical crosses held a full year, and the signal has triggered premature bull traps three times as often as sustained multi-year rallies.
-
What was Bitcoin's price when the latest golden cross triggered?
Bitcoin changed hands at $78,650 at the time of the cross, down 0.6% since midnight UTC, per CoinDesk data.
 Crypto News
 WuBlockchain
 Lookonchain
 TheBlock
 CryptoSlate
 Benjamin Cowen