








 CoinDesk


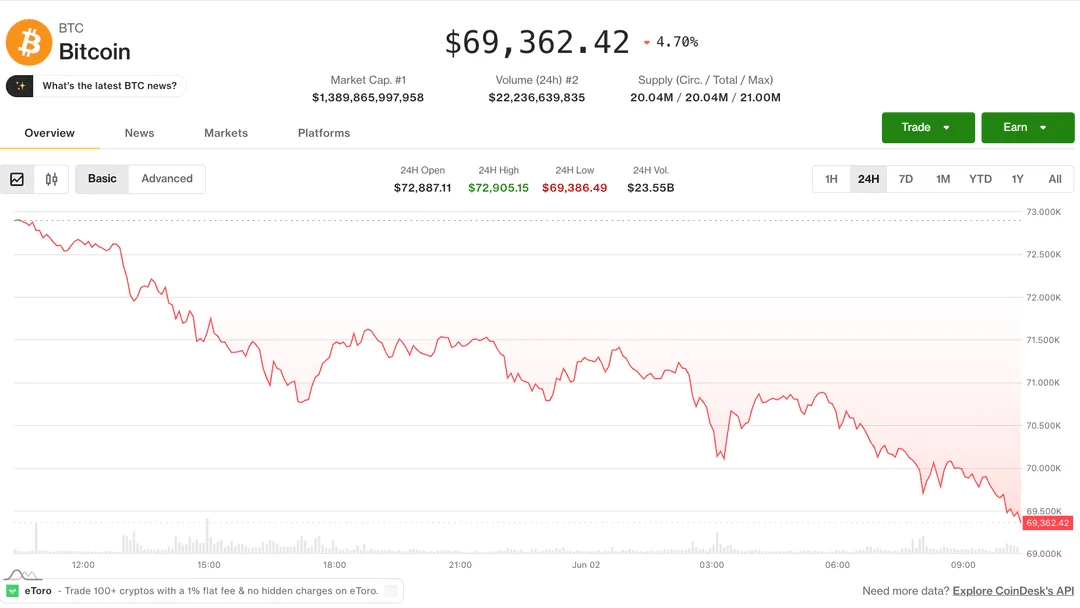
Bitcoin dropped more than 4.45% over the past 24 hours, trading near $69,400, while ether slipped 0.6% to $1,970 and the broader CoinDesk 20 index retreated 3.2%. The move comes against the backdrop of an 11th consecutive day of net outflows from spot bitcoin ETFs, with investors pulling roughly $3.45 billion across the streak — the largest and longest withdrawal run on record. Strategy sold 32 BTC for $2.5 million, a rounding error against its holdings but symbolically loaded enough to draw headlines.
Why it matters
Pierre Rochard, a bitcoin researcher and Strive board member, argues Saylor isn't the real driver. The pressure point, he wrote on X, is a massive parabolic spike in AI-related equities that is vacuuming up liquidity in multiples of bitcoin's market cap. A healthy labour market and elevated energy prices have killed the dovish-cut narrative, leaving the macro backdrop unfriendly even though, as Rochard put it, bitcoin's fundamentals "have never been better."
Market impact
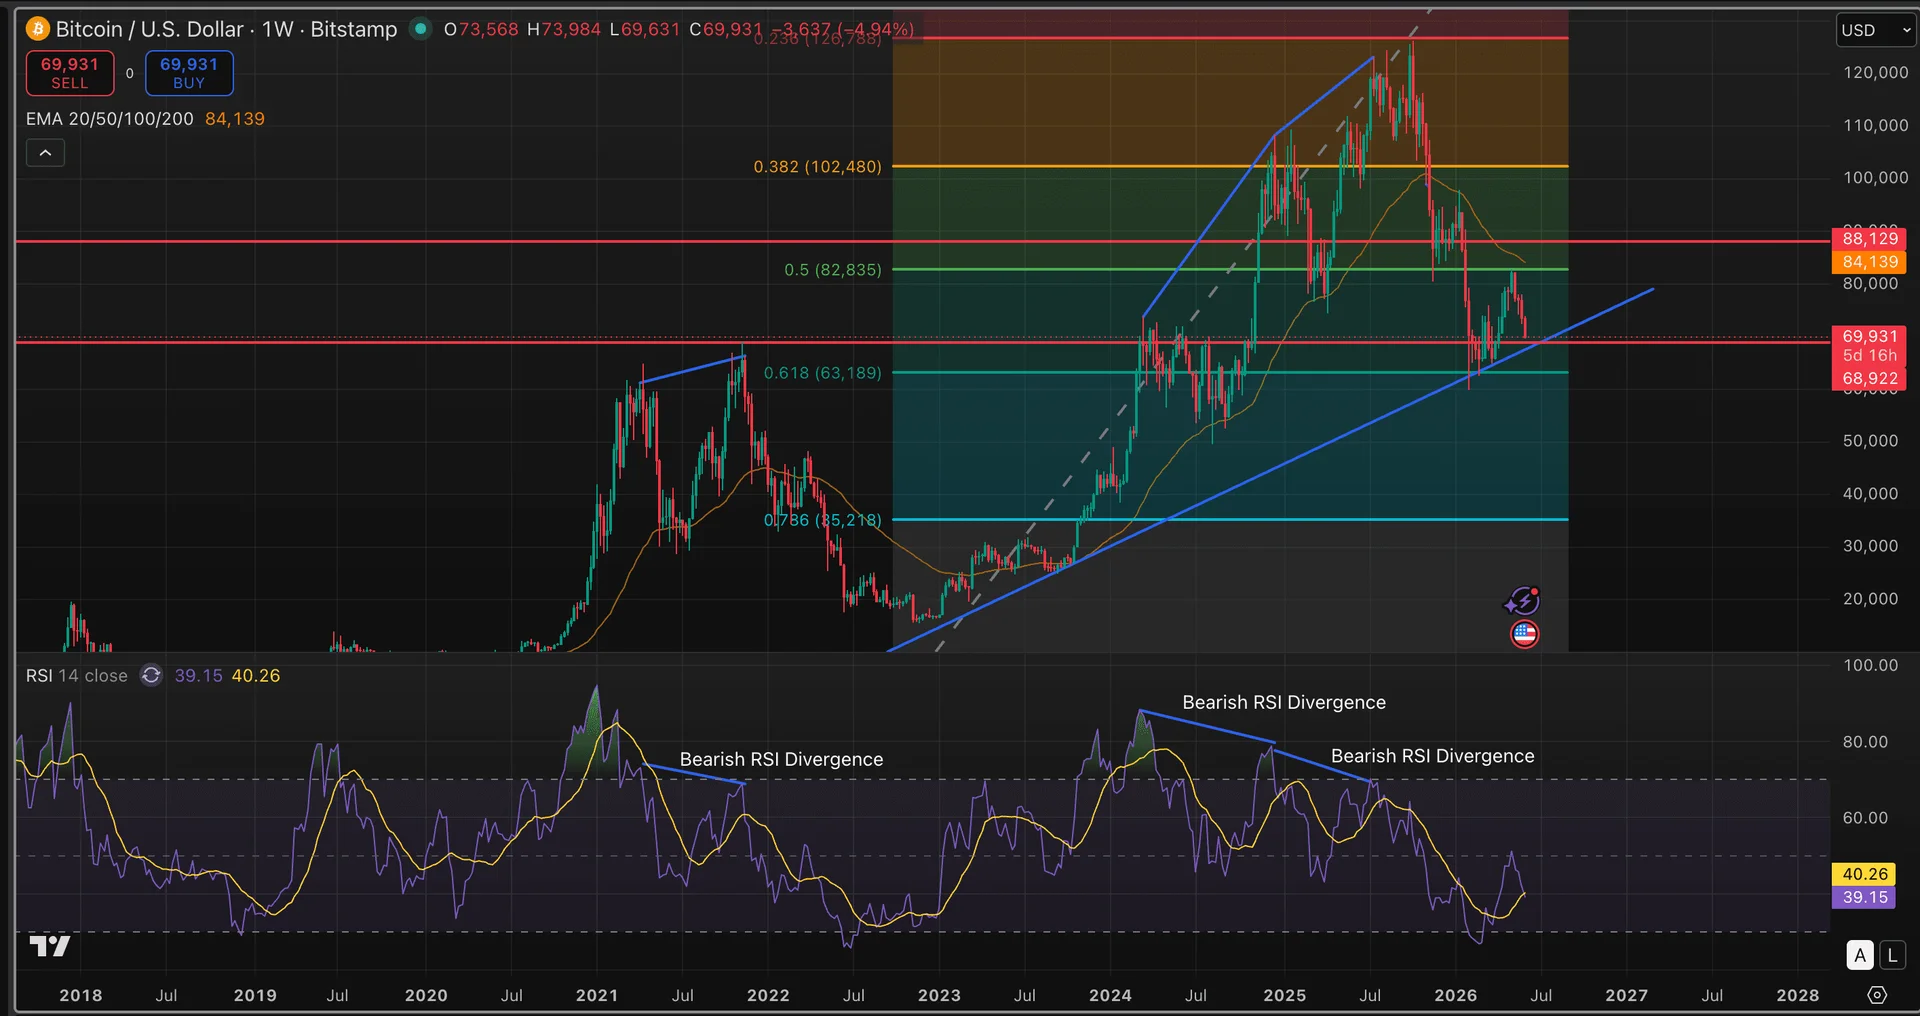
The weekly chart is now testing a key confluence: the 0.618 Fibonacci near $69,000 stacked with the long-term ascending trendline from the 2022 lows. RSI sits near 39 with no bullish divergence yet — so this is a structural level test, not a confirmed bottom. The next major catalyst is Friday's U.S. jobs print: a strong number keeps rate-cut hopes subdued and risks another leg lower, while softer data could let bitcoin reclaim $70,000.


Frequently asked questions
-
Why is bitcoin falling if Strategy only sold 32 BTC?
Pierre Rochard argues the real pressure is a parabolic spike in AI-related equities pulling excess liquidity away from crypto — not Saylor's small sale. Strategy's 32 BTC is symbolic; the structural driver is cross-asset rotation into AI.
-
How bad are the spot bitcoin ETF outflows really?
Eleven consecutive trading sessions of net outflows, totalling roughly $3.45 billion — both the largest single-day runs and the longest streak since the products launched, according to CoinDesk.
-
What key technical level is bitcoin testing now?
The weekly chart is at a confluence of the 0.618 Fibonacci retracement near $69,000 and the long-term ascending trendline from the 2022 lows. RSI sits near 39 with no bullish divergence, so it remains a structural test rather than a confirmed bottom.
-
Could Friday's U.S. jobs report turn this around?
It's the next major catalyst. A strong print would keep rate-cut hopes subdued and risk another leg lower; a softer print could let bitcoin reclaim $70,000 and relieve some of the macro pressure weighing on the tape.
-
Are bitcoin's on-chain fundamentals still strong?
Rochard says yes — he framed the move as a liquidity rotation rather than a fundamentals break, writing that bitcoin's fundamentals "have never been better" even as price softens against the AI trade.
 WatcherGuru
 Lookonchain
 Glassnode
 Crypto Rank News
 Crypto News
 Altcoin Daily
 WuBlockchain
 CryptoSlate