








 CoinDesk
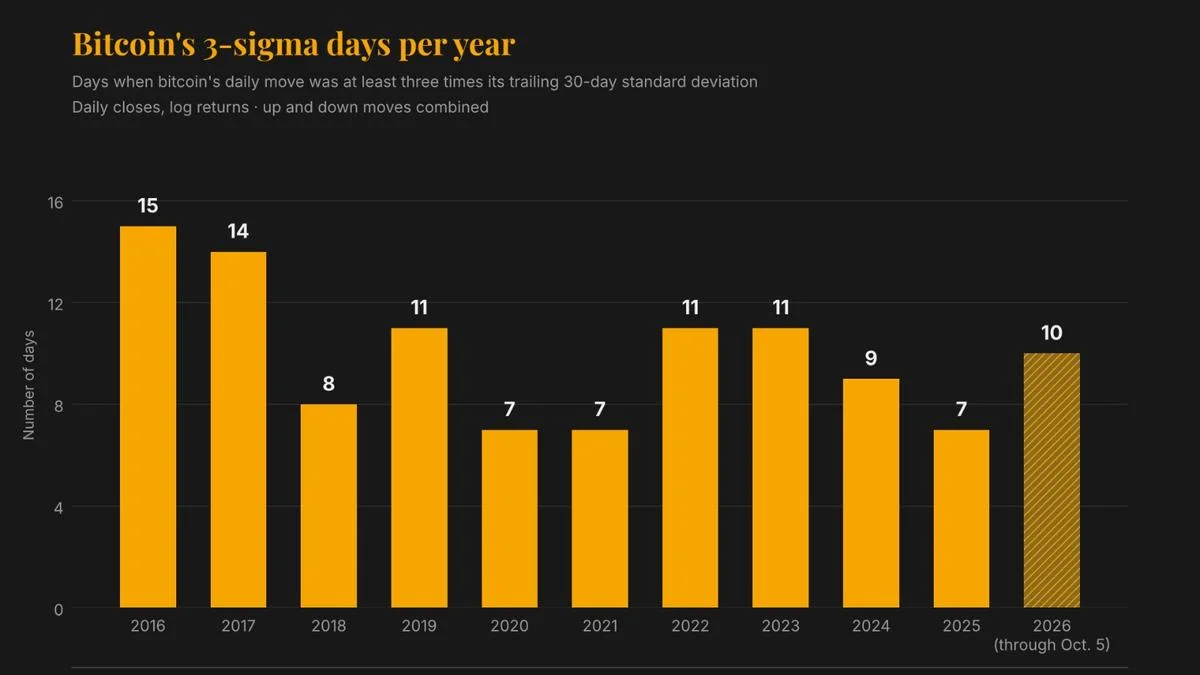
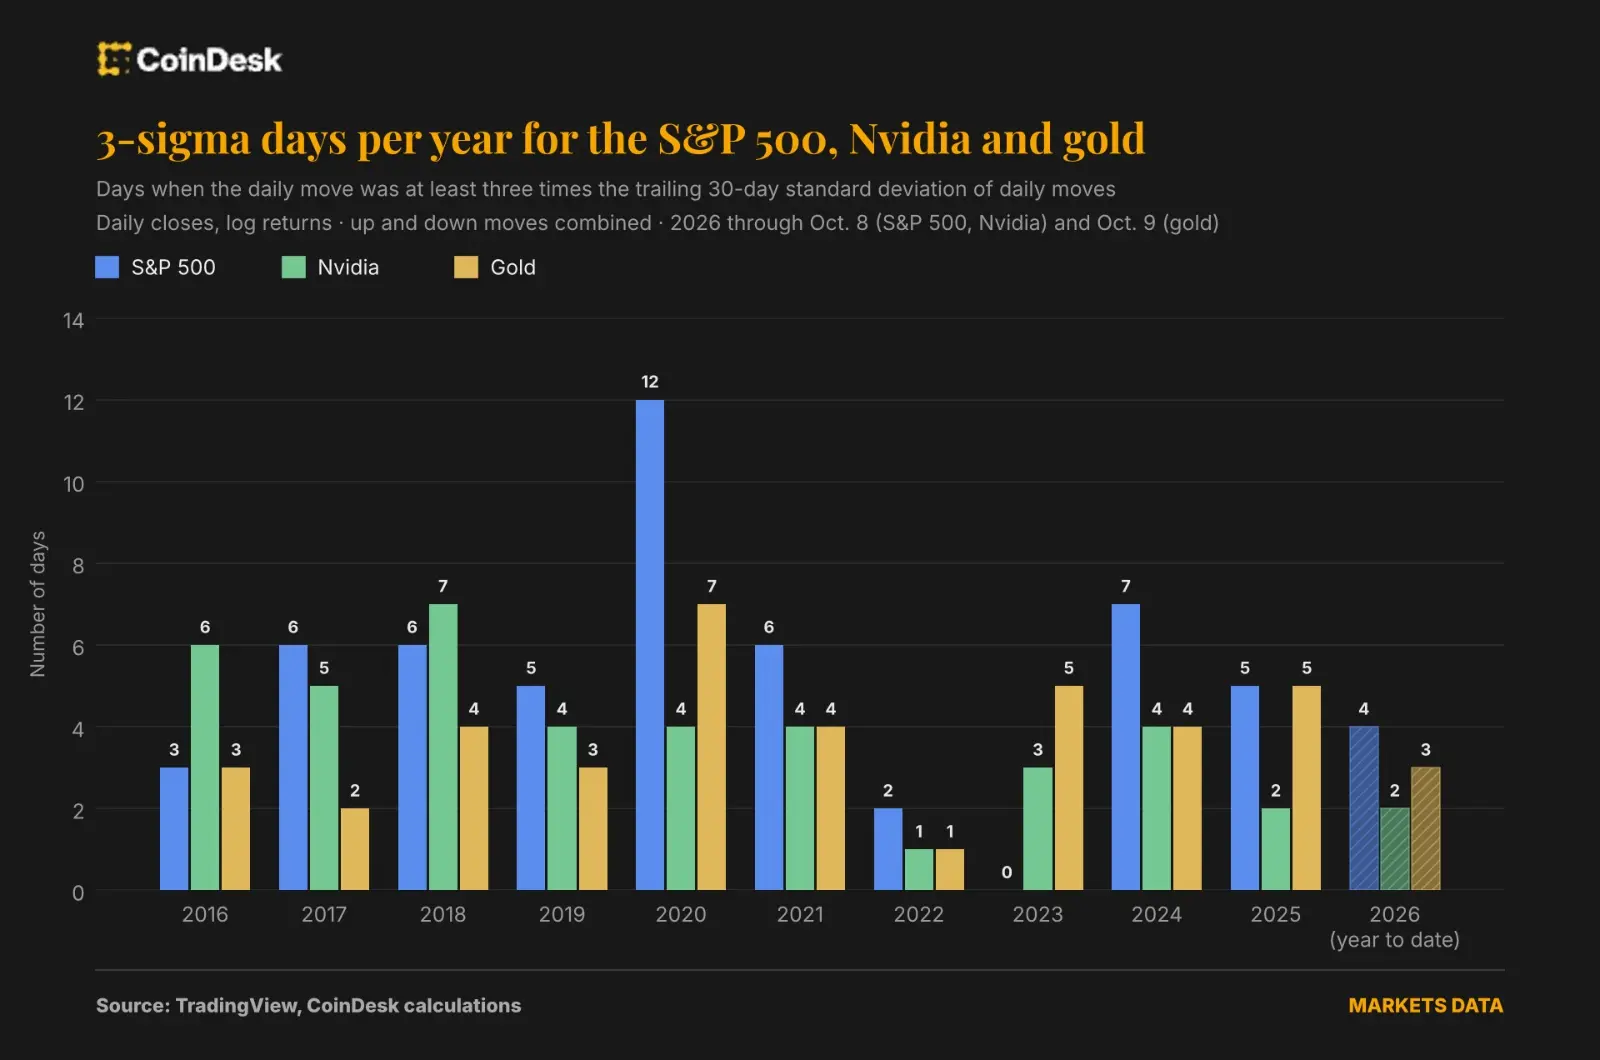


Bitcoin has logged 10 days in 2026 when its price moved at least three standard deviations from its recent trading pattern, according to a CoinDesk analysis, more than the eight such days recorded during all of 2018, when the asset lost 73% of its value. Annualized volatility has fallen to about 46% from 84% over the same span, while the average size of those 3-sigma moves has shrunk to roughly 7% from about 10%.
Why it matters
Calmer average days are masking a more frequent tail, a combination that confounds risk models built on recent volatility. Value-at-risk frameworks that lean on trailing 30-, 90- and 180-day windows will read the lower realized vol as a green light to size up, while the underlying distribution keeps producing outsized jolts that VaR alone does not price. Nicolas Quatravaux, head of EMEA at Paradigm, framed the pattern as structural: long quiet stretches followed by sharp repricings, with the shocks now arriving from macro, leverage and crowded positioning rather than from thin liquidity.
Market impact
The implication for portfolio construction is direct. Luuk Strijers, CEO of Deribit, said standard VaR underestimates tail risk and is why the industry is migrating toward Expected Shortfall, which prices how bad the worst days actually get. That shift matters because Bitcoin's 3-sigma tally since 2024 has run to 26 days, versus eight for Nvidia, 16 for the S&P 500 and 12 for gold, even though Bitcoin's headline volatility now sits close to Nvidia's near 47%. The market is also absorbing the jolts better: on September 21, Paradigm cleared a record $6.7 billion in options without a single desk reporting a bad hit, evidence that deeper liquidity and more institutional counterparties are turning what used to be a wipeout day into a tough month.
The next tell is whether that institutional cushion holds the next time a macro headline catches a crowded short-vol book on the wrong side.

Frequently asked questions
-
What is a three-sigma trading day for Bitcoin?
A day when Bitcoin's price moves at least three standard deviations from its recent trading pattern. In a normal bell-shaped distribution only 0.3% of moves fall outside that band, so traders use it to flag unusually large jumps.
-
How does lower volatility hide bigger tail risk in Bitcoin?
Value-at-risk models lean on trailing 30-, 90- or 180-day volatility windows, so a stretch of calmer trading makes Bitcoin appear less risky and can justify larger allocations, even though 3-sigma jolts keep showing up at a higher frequency than in 2018.
-
How many three-sigma days has Bitcoin had in 2026?
Bitcoin has logged 10 three-sigma trading days in 2026 so far, more than the eight recorded across all of 2018, when Bitcoin lost 73% of its value.
-
Why are extreme Bitcoin moves more frequent now even though they are smaller?
Crowded short-volatility and call-overwriting positioning mean a single macro headline can trigger a short squeeze, while deeper liquidity and more institutional counterparties absorb the move so it does not cascade into a wipeout.
-
What is Expected Shortfall and why does Deribit prefer it for crypto?
Expected Shortfall estimates the average size of losses on the worst days rather than just counting how often a threshold is breached. Deribit CEO Luuk Strijers argues it captures Bitcoin's recurring three-sigma jolts better than value-at-risk alone.
 Lookonchain
 WatcherGuru
 WuBlockchain
 TheBlock
 CoinTelegraph
 Whale Alert