








 CoinDesk
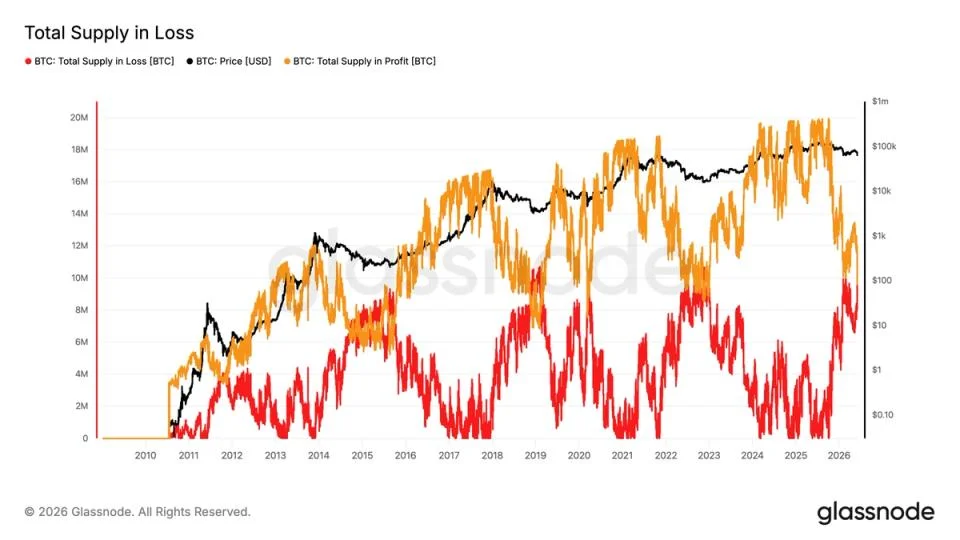


More than half of all bitcoin in circulation is now held at an unrealized loss, with 10.5 million BTC underwater compared with 9.8 million BTC still in profit. According to Glassnode data at one-hour resolution, the loss-side figure peaked as BTC fell to as low as $61,300 on Thursday — the first time in the current cycle that supply in loss has exceeded supply in profit. Against roughly 20 million BTC in total circulating supply, the split marks a sharp departure from the position breakdown that has prevailed for most of the post-halving rally.
Why it matters
The loss-versus-profit crossover has historically lined up with major bear-market lows. In 2015, supply in loss and supply in profit sat near equilibrium for almost a year before recovery; in 2019, the condition lasted roughly six months; the Covid-driven capitulation of March 2020 resolved in about a month; and the 2022 bear market ran close to six months. The shared signal is the crossover itself; the duration has varied widely, so the metric identifies the regime rather than the timeline.
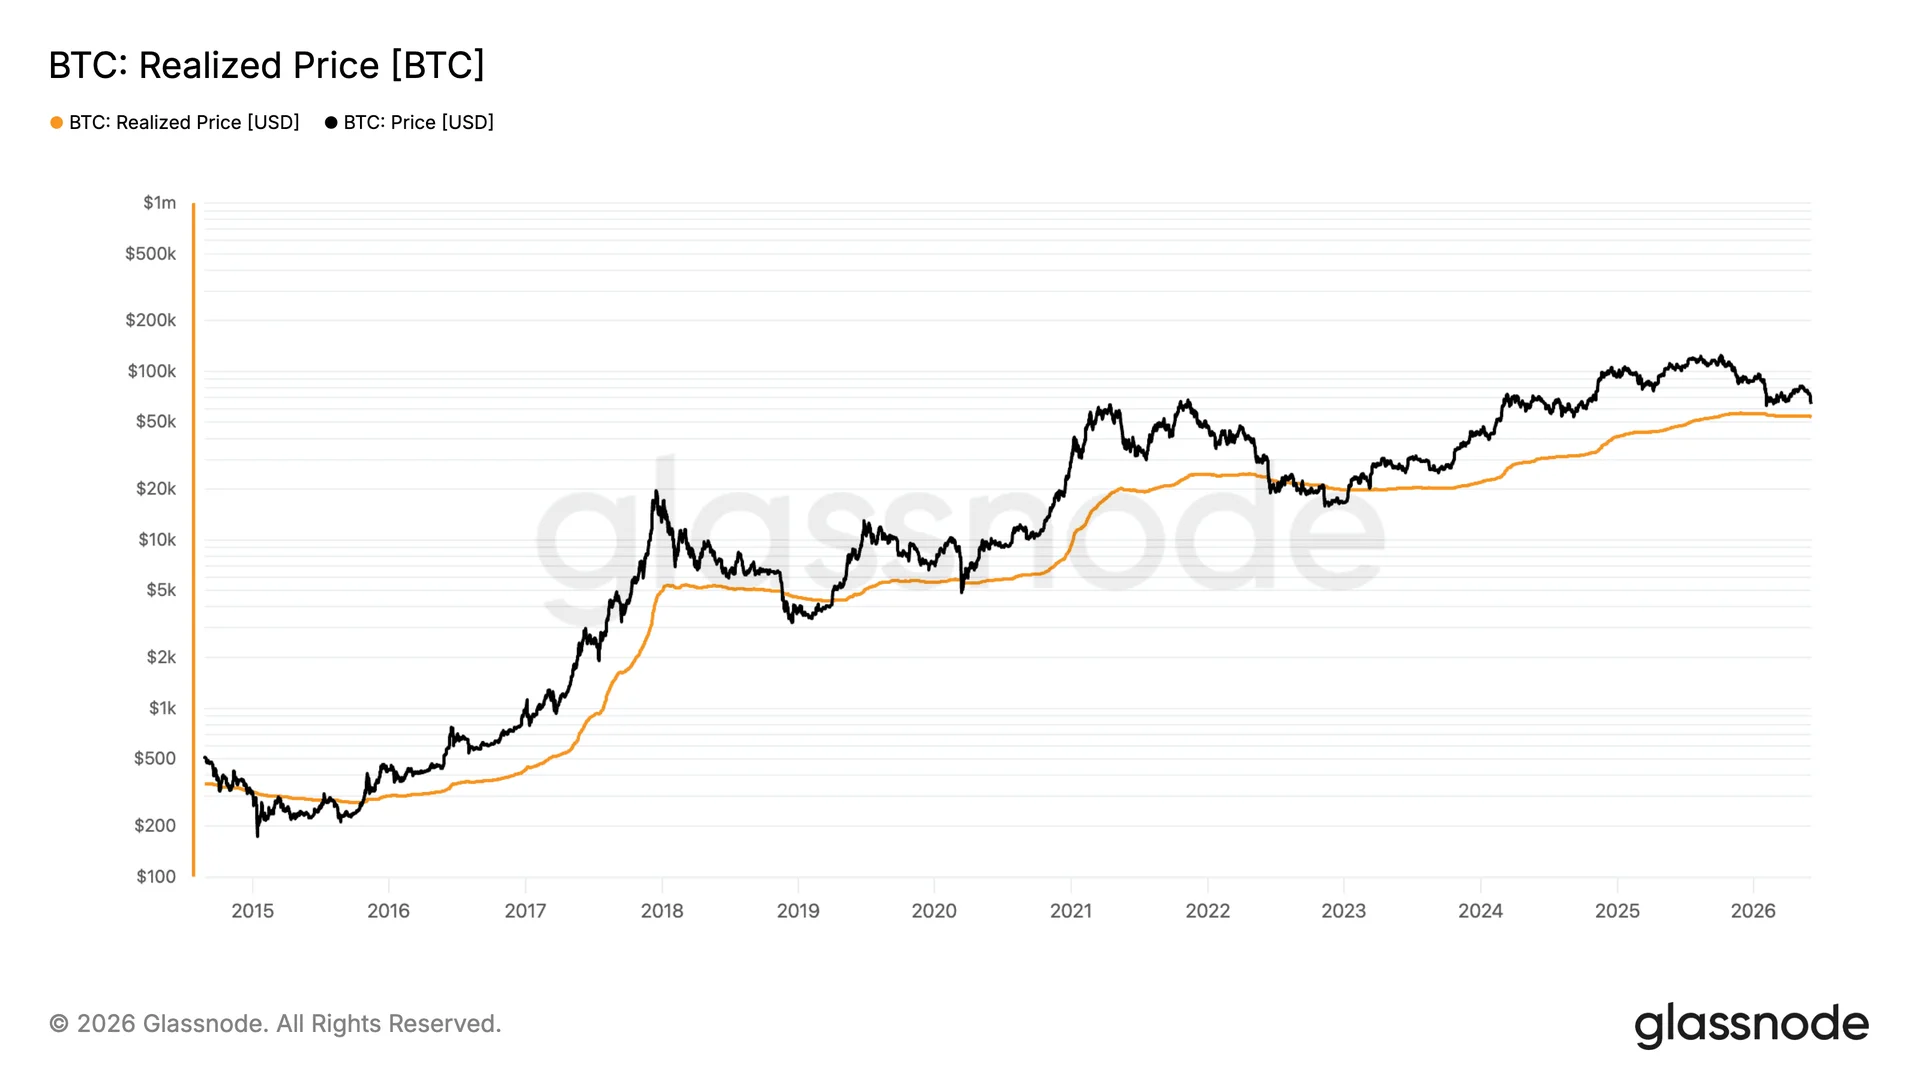
Adding weight to the setup, BTC touched its 200-week moving average near $61,300 — a long-term trend line that has acted as major support in every prior bear cycle. The realized price, which captures the average onchain acquisition cost of all circulating BTC, sits near $54,000 and has marked the floor in every previous drawdown. A break below $60,000 would put realized price back on the table as the next significant support zone.
Market impact
The structural read: holders who bought anywhere from late 2024 into the current quarter are now sitting on losses, and the marginal cost basis across the network is meaningfully above spot. Historically, that condition has marked exhaustion rather than the start of fresh downside — but only after the loss-side supply has had time to cycle through weak hands. Watch the $60,000-$61,300 band for a hold; a weekly close below it shifts attention to $54,000, where the realized price sits. The metric has marked bottoms before, but it has never told traders how long the bottom lasts.

Frequently asked questions
-
What is the BTC supply-in-loss versus supply-in-profit crossover?
It is the point at which the amount of bitcoin held at an unrealized loss exceeds the amount held in profit. Glassnode data shows 10.5M BTC underwater against 9.8M BTC in profit, against roughly 20M BTC in total circulating supply.
-
Why is the 200-week moving average significant for bitcoin?
The 200-week moving average — near $61,300 — is a long-term trend indicator that has acted as major support during every prior bear market. Bitcoin tested it on Thursday as price fell to as low as $61,300.
-
How long did past loss-versus-profit crossovers last?
Duration has varied widely. The 2015 bear market held the condition near equilibrium for almost a year; 2019 ran about six months; the March 2020 Covid capitulation lasted around one month; and the 2022 bear market persisted for roughly six months.
-
What is bitcoin's realized price and why does it matter at $54,000?
Realized price is the average acquisition cost of all circulating BTC, calculated from the price at which each coin last moved onchain. It sits near $54,000 and has acted as the major support floor in every previous drawdown, making it the next key level if $60,000 breaks.
-
Does the loss/profit crossover guarantee a bear-market bottom?
The crossover has historically coincided with major bear-market bottoms, but it identifies regime rather than timing. Past episodes lasted anywhere from one month to nearly a year, so the metric signals exhaustion conditions without indicating how long the bottom will persist.
 CryptoSlate
 Crypto News
 WatcherGuru
 Lookonchain
 Crypto Rank News
 TheBlock
 CoinTelegraph
 Whale Alert