








 CoinDesk
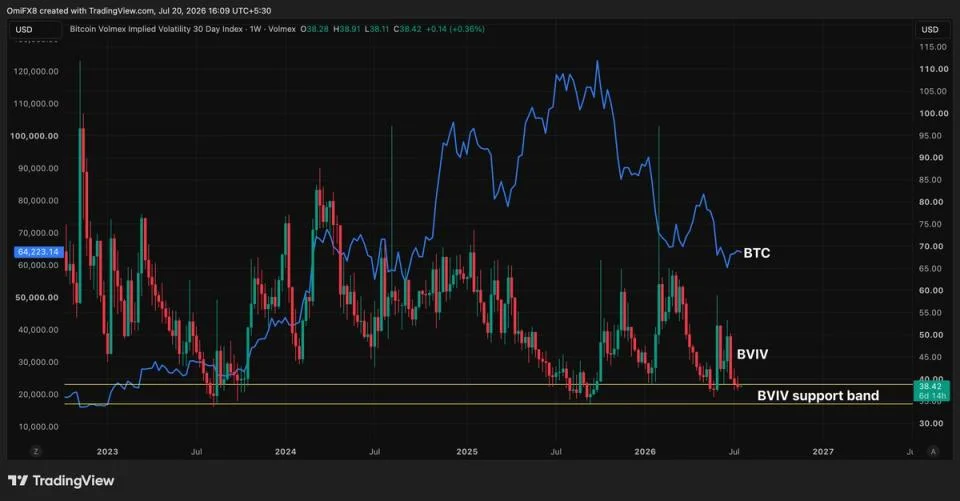



Bitcoin's 30-day implied volatility index, BVIV, is hovering between 34% and 38%, a zone that in recent years has repeatedly preceded sharp BTC drawdowns. The index is now trading below both its 30-day and 200-day simple moving averages, leaving volatility historically cheap and parked at a support level that has reliably marked tops in complacency.
BTC itself continues to trade just above $64,000 in a range that has held since last Wednesday, masking the building undercurrent. Two consecutive weeks of spot ETF inflows have come in tiny next to the eight-week outflow streak they followed, leaving net positioning light.
Why it matters
BVIV behaves much like Wall Street's VIX: demand for protective options flows directly into the gauge, and the 34%-38% band has functioned as a coiled-spring setup. Bitcoin dropped from $74,000 to under $60,000 in under a week the last time BVIV sat there in late May. A similar pattern played out just before the early February crash and during the post-October correction from record highs. Vol metrics are widely treated as mean-reverting, so a quiet patch below average volatility historically hands back to turbulence.
Market impact
If BVIV mean-reverts upward from this band, the first market read would be a repricing of options premiums across Deribit and offshore venues, with skew steepening fast toward puts. Spot typically catches down within sessions once vol starts expanding, and realized 30-day vol tends to follow implied higher. Watch the upper boundary at 38%: a clean break above opens the door to a 50%+ spike in BVIV, the kind of move that historically drags BTC 10%-15% inside two weeks.

Frequently asked questions
-
What is BVIV and why does it matter for bitcoin?
BVIV is bitcoin's 30-day implied volatility index, often framed as the crypto equivalent of Wall Street's VIX. It rises when traders bid up protective options, and falling levels signal complacency that has historically preceded sharp BTC drawdowns.
-
Why is the 34% to 38% BVIV range treated as a warning zone?
Each time BVIV has dropped into the 34%-38% band over the past year, a volatility expansion and bitcoin price slide followed. Late May took BTC from $74,000 to under $60,000 in under a week, and similar patterns played out before the early February crash and the October correction.
-
Where is BVIV trading right now relative to its moving averages?
BVIV is hovering near 38%, close to the upper edge of its support band, and is currently trading below both its 30-day and 200-day simple moving averages, a setup described as historically cheap volatility.
-
What would confirm a vol expansion in bitcoin?
A clean break above 38% on BVIV would open the door to a sharper move higher in implied volatility, the kind of expansion that has historically dragged BTC 10% to 15% lower within two weeks in prior episodes.
-
How are traditional volatility gauges influencing the bitcoin setup?
Korea's KOSPI VIX is above 70%, its highest level since the 1990s. Wall Street's VIX jumped over 12% to 18% on Friday, and the MOVE index for U.S. Treasuries sits steady near 70% as it has since April, a mixed backdrop that historically hands off into crypto-specific vol expansions.
 Whale Alert
 Crypto News
 CoinTelegraph
 TheBlock