 CoinDesk

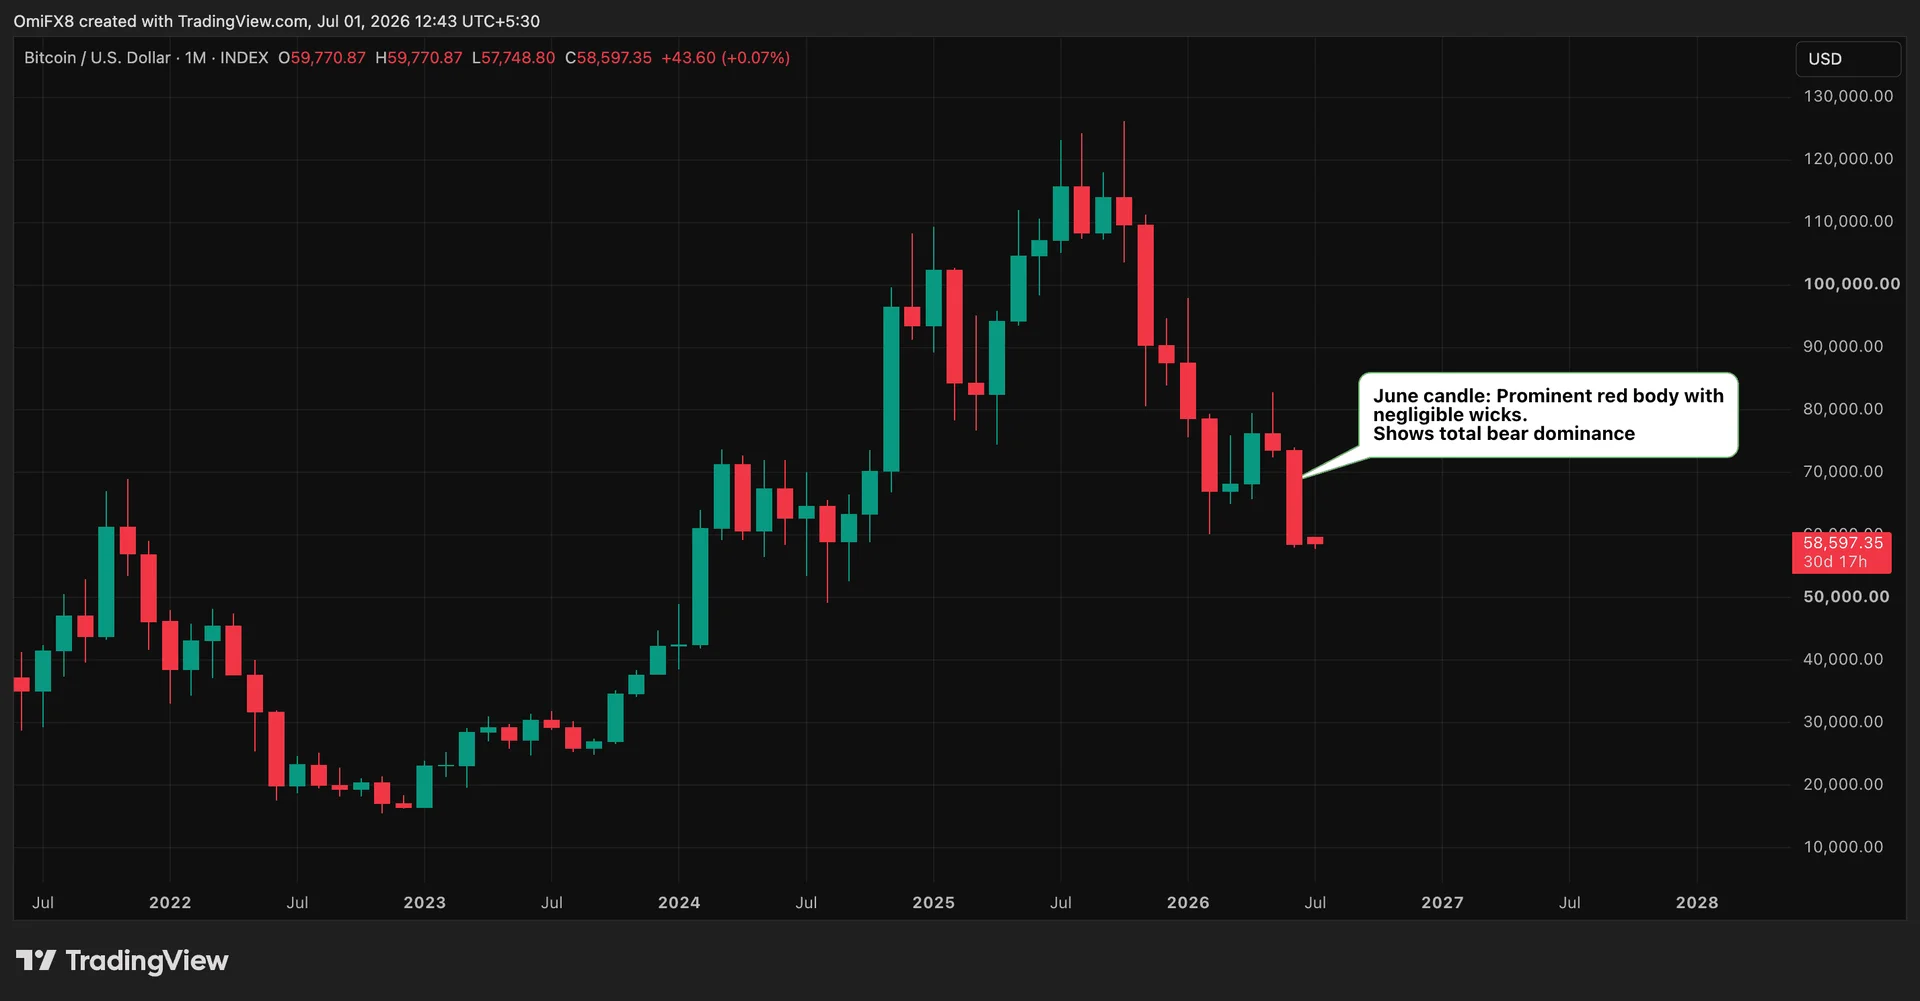


Bitcoin closed June near $58,600, capping a roughly 20% monthly drop, its worst monthly performance since June 2022. The move itself was brutal, but the June monthly candle tells an even uglier story: a solid red body with virtually no visible wicks, the visual signature of uninterrupted, one-directional selling across all 30 days.
Why it matters
The pattern is what technicians call a Marubozu, from the Japanese for "shaved" or "bald," a candle with no upper or lower shadow. Its appearance on a monthly timeframe is rare precisely because markets are inherently two-sided: even in bad months, recoveries, squeezes, or short squeezes usually leave a trace of two-sided volatility on the wicks. June produced none of that. Bulls never meaningfully challenged the June 1 open, and there was no relief rally off the lows to invalidate the drift lower.
The formation is consistent with a string of bearish analyst calls pointing to a deeper slide, with the eventual cycle bottom framed in the $48,000 to $55,000 zone, well below where Bitcoin entered the month.
Market impact
A Marubozu on the monthly chart carries weight because most market participants do not trade monthly candles directly; they trade the implications. A clean, wickless red monthly close tells trend-following systems and longer-horizon funds that the prior month's high was never reclaimed, which usually extends the duration of the prevailing move rather than inviting a sharp, V-shaped reversal. In prior cycles, Marubozu-style monthly prints were typically followed by additional downside before any durable low formed.
The next inflection points to watch are whether July prints a lower wick (the first sign of buyers stepping in), whether the $48K to $55K zone holds on a retest, and whether spot ETF flows turn net positive again after the June drawdown. Until one of those flips, the tape looks like sellers still in control.

Frequently asked questions
-
What is a Marubozu candlestick pattern?
A Marubozu is a candlestick with virtually no upper or lower wicks, meaning price moved almost in a straight line from open to close with no meaningful reversals in between. The name comes from the Japanese for 'shaved' or 'bald' head.
-
How rare is a Marubozu on a Bitcoin monthly chart?
Markets are inherently two-sided, so most monthly candles produce at least some wick action from short squeezes or relief rallies. A clean, wickless monthly close like June's is uncommon and signals dominant one-directional control, in this case by sellers.
-
How much did Bitcoin fall in June 2025?
Bitcoin dropped roughly 20% in June, closing near $58,600. It was the asset's worst monthly performance since June 2022, when the prior cycle bottom was forming.
-
Where are analysts expecting the next Bitcoin bottom?
Recent analyst calls framed the eventual cycle bottom in the $48,000 to $55,000 zone, well below where Bitcoin entered June. The Marubozu print is consistent with that deeper-slide thesis.
-
What signals would invalidate the bearish June candle?
A visible lower wick on the July monthly candle, a successful retest and hold of the $48K to $55K band, or a flip back to net positive spot ETF flows would each chip away at the bearish read. Until one of those prints, the monthly chart belongs to the sellers.