 CoinDesk
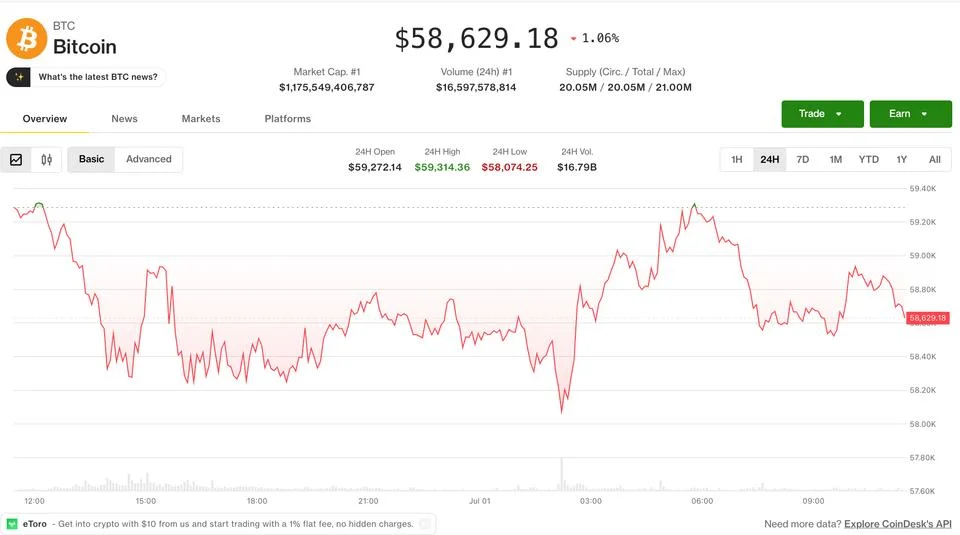


Bitcoin slipped to $57,700 in early trade, its lowest level since September 2024, before recovering to $58,800 as $395 million in leveraged longs were liquidated across crypto derivatives venues. Ether followed the same path, sliding toward $1,580 before a modest relief bounce off the lows.
The derivatives tape tells the sharper story. Puts are now trading at a premium to calls on Deribit across every timeframe, and Paradigm reported a notable block trade targeting a $50,000 BTC put at the September expiry, a bet that prices could fall another 15% before the end of Q3. BTC futures open interest climbed to 768,000 BTC from 740,000 a day earlier, with the 24-hour cumulative volume delta skewed negative and bears trading aggressively with market orders rather than passive limits.
Why it matters
The directional signal is no longer hidden in the price action. U.S. equity index futures are lower across the board, S&P 500 and Nasdaq 100 contracts down 0.2% to 0.4%, and a stronger dollar is keeping pressure on risk assets broadly. Gold has done little to help: its spot chart just printed a bearish death cross, with the 50-day SMA crossing below the 200-day SMA, a pattern now echoing across prominent gold ETFs. Gold perpetual futures open interest on crypto venues hit a record 222,000 XAU tokens, a sign that capital is still willing to chase the safe-haven trade even as the chart itself turns bearish.
Market impact
The altcoin complex is taking the worst of it, where thin liquidity turns modest moves into liquidation cascades. AI tokens like Bittensor have given back more than 30% since June 15. A handful of names are bucking the trend: Solana DEX aggregator Jupiter (JUP) jumped 11.5% on a 55% surge in daily volume as TVL climbed above 20 million SOL from 13.9 million in May, and Stellar (XLM) extended a weekly rally to 16%, keeping CoinMarketCap's altcoin season index stuck near 48/100. Bitcoin and ether's 30-day implied volatility indexes are range-bound, with BVIV hemmed between its 200-day moving average as resistance and its 50-day as support, a setup where a break above resistance would likely signal a deeper slide, not a recovery.


Frequently asked questions
-
Why did Bitcoin drop to $57,700 and what triggered the liquidations?
Bitcoin fell to $57,700, its lowest level since September 2024, before recovering to $58,800. $395 million in leveraged long positions were liquidated across crypto derivatives venues as bears traded aggressively with market orders.
-
What does the $50,000 BTC put block trade signal?
Over-the-counter desk Paradigm reported notable demand for a September-expiry bitcoin put at the $50,000 strike. The position implies traders expect BTC to fall another 15% from current levels before the end of Q3.
-
What is the gold death cross and why does it matter for crypto?
Gold's spot chart just printed a bearish death cross, with the 50-day simple moving average crossing below the 200-day SMA. The same pattern is appearing on prominent gold ETFs, reinforcing a broader risk-off environment that has historically weighed on crypto.
-
Why are altcoins underperforming Bitcoin and Ether right now?
Altcoins lack the liquidity and demand to absorb sharp downside moves, turning modest drops into liquidation cascades. AI tokens like Bittensor have lost more than 30% since June 15, while Bitcoin and Ether's bigger market caps hold up relatively better.
-
What does Bitcoin's implied volatility setup suggest about the next move?
Bitcoin's 30-day implied volatility index, BVIV, is range-bound between its 200-day moving average as resistance and its 50-day as support. A break above the 200-day resistance would likely signal a deeper price slide rather than a recovery.