








 Crypto News
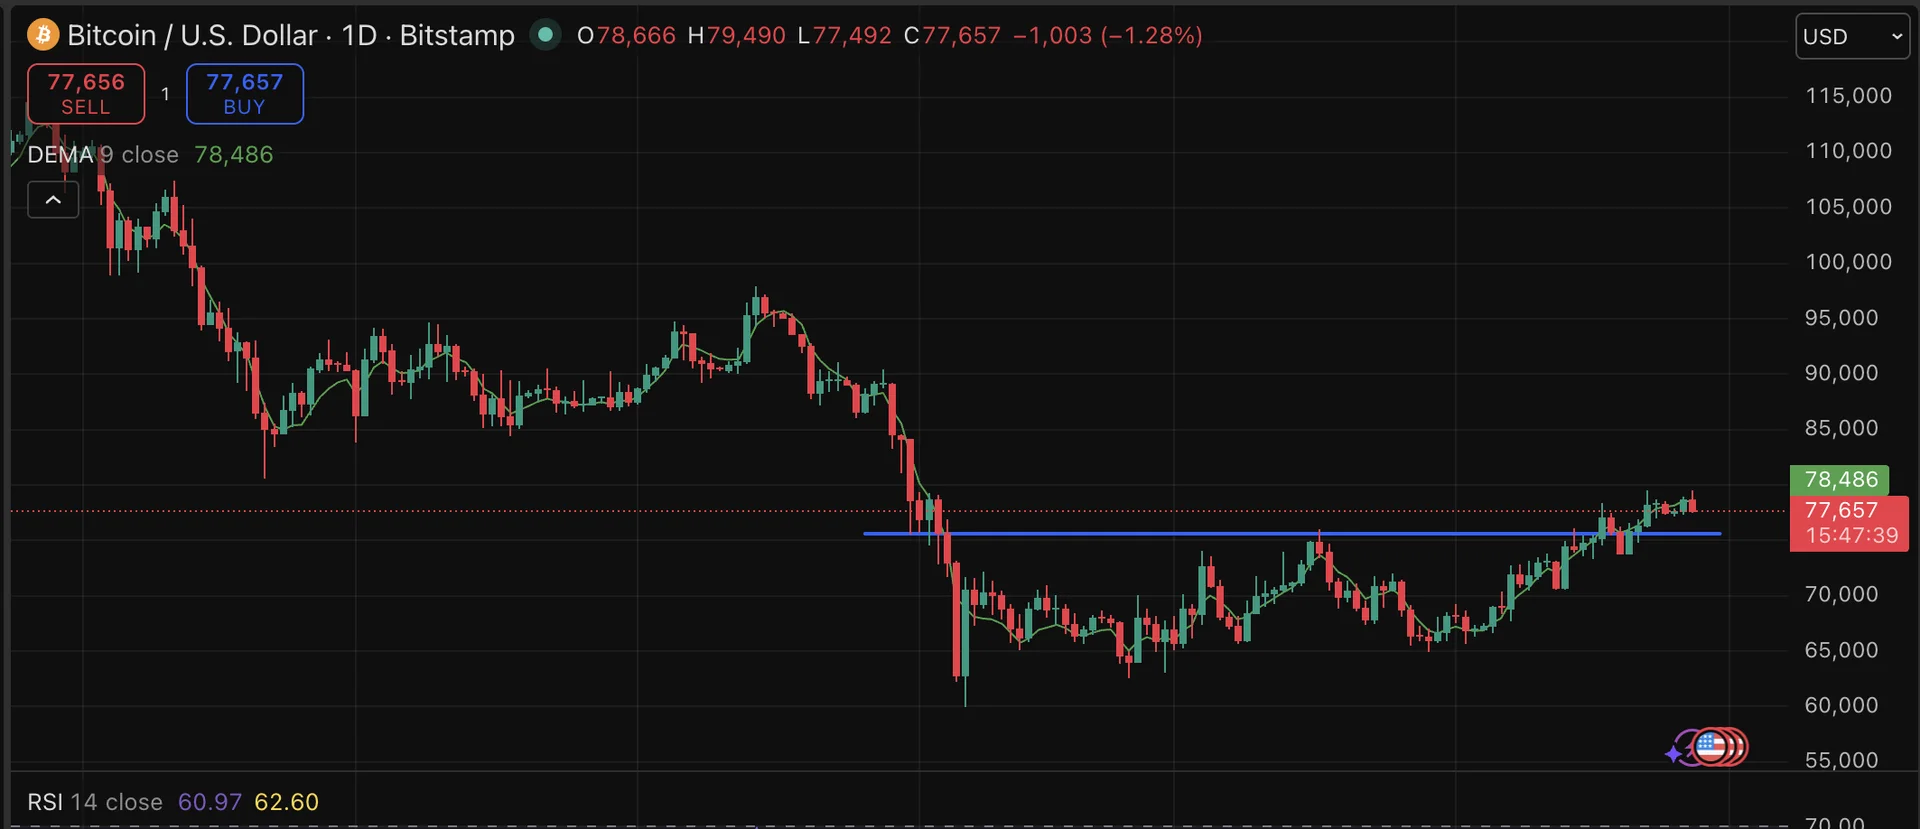


Bitcoin spiked to $79,400 in early Monday trading before reversing sharply, with the $80,000 ceiling holding for another rejection and BTC sliding back below $78,000 within hours. A report that Iran had offered the US a new proposal to reopen the Strait of Hormuz briefly lifted risk appetite, but the relief trade evaporated as rising oil prices and unresolved geopolitical tensions reasserted control. Spot BTC is trading below $77,000 this morning, with the $79,000–$80,000 band now acting as a confirmed resistance zone across multiple weekly attempts.
Why it matters
Three consecutive weeks of rejection at roughly the same level is the kind of price action that starts to look like distribution rather than accumulation. CoinGlass order-book data shows dense sell liquidity stacked between $78,000 and $80,000 in two separate clusters, and analyst Elja has flagged the $78,000 zone as former weekly support flipped to resistance. A failure to close above it this week would stall the entire recovery thesis and open the door to a bear-flag breakdown.
Market impact
Technical composite readings from 13 indicators are flashing a 40% sell signal, even as RSI holds in neutral at 62. A weekly close above $79,400 would put $82,000 on the table as the next upside target. Another rejection at $79,000 risks a slide toward $75,000 and then the $73,500 demand zone. Asian equities sitting at record highs on the Nikkei and KOSPI are not providing spillover support, and the macro impulse is fading fast each time BTC tests overhead supply.

Frequently asked questions
-
Why did Bitcoin drop on Monday after spiking to $79,400?
An early-session spike on reports Iran had offered the US a new proposal to reopen the Strait of Hormuz gave way to a sharp reversal as rising oil prices and unresolved geopolitical tensions reasserted control, dragging BTC back below $78,000 within hours.
-
What is the $80,000 resistance level significance for Bitcoin?
Bitcoin has now failed to break the $79,000–$80,000 band for three consecutive weeks, with CoinGlass showing dense sell-side liquidity stacked between $78,000 and $80,000. Analyst Elja flagged the $78,000 zone as former weekly support flipped to resistance.
-
What are the key support levels for BTC if $80K rejection continues?
A failure to close above $79,400 this week risks a bear-flag breakdown toward $75,000, which could open the door to the $73,500 demand zone. Technical composite readings from 13 indicators are already flashing a 40% sell signal.
-
What would invalidate the bearish BTC setup this week?
A weekly close above $79,400 — Bitcoin's first major resistance — would put $82,000 on the table as the next upside target and undo the distribution pattern forming at overhead supply.
-
Are Asian equity records supporting Bitcoin's price action?
No. The Nikkei and KOSPI both sit at record highs, but the rallies are not spilling over into crypto. Bitcoin continues to get rejected at overhead supply while Asian indices push higher, leaving BTC isolated from broader risk-on flows.
 WuBlockchain
 Lookonchain
 Benjamin Cowen
 Crypto Capital Venture
 Crypto Rank News
 Glassnode
 CoinDesk
 CryptoSlate