








 CoinDesk

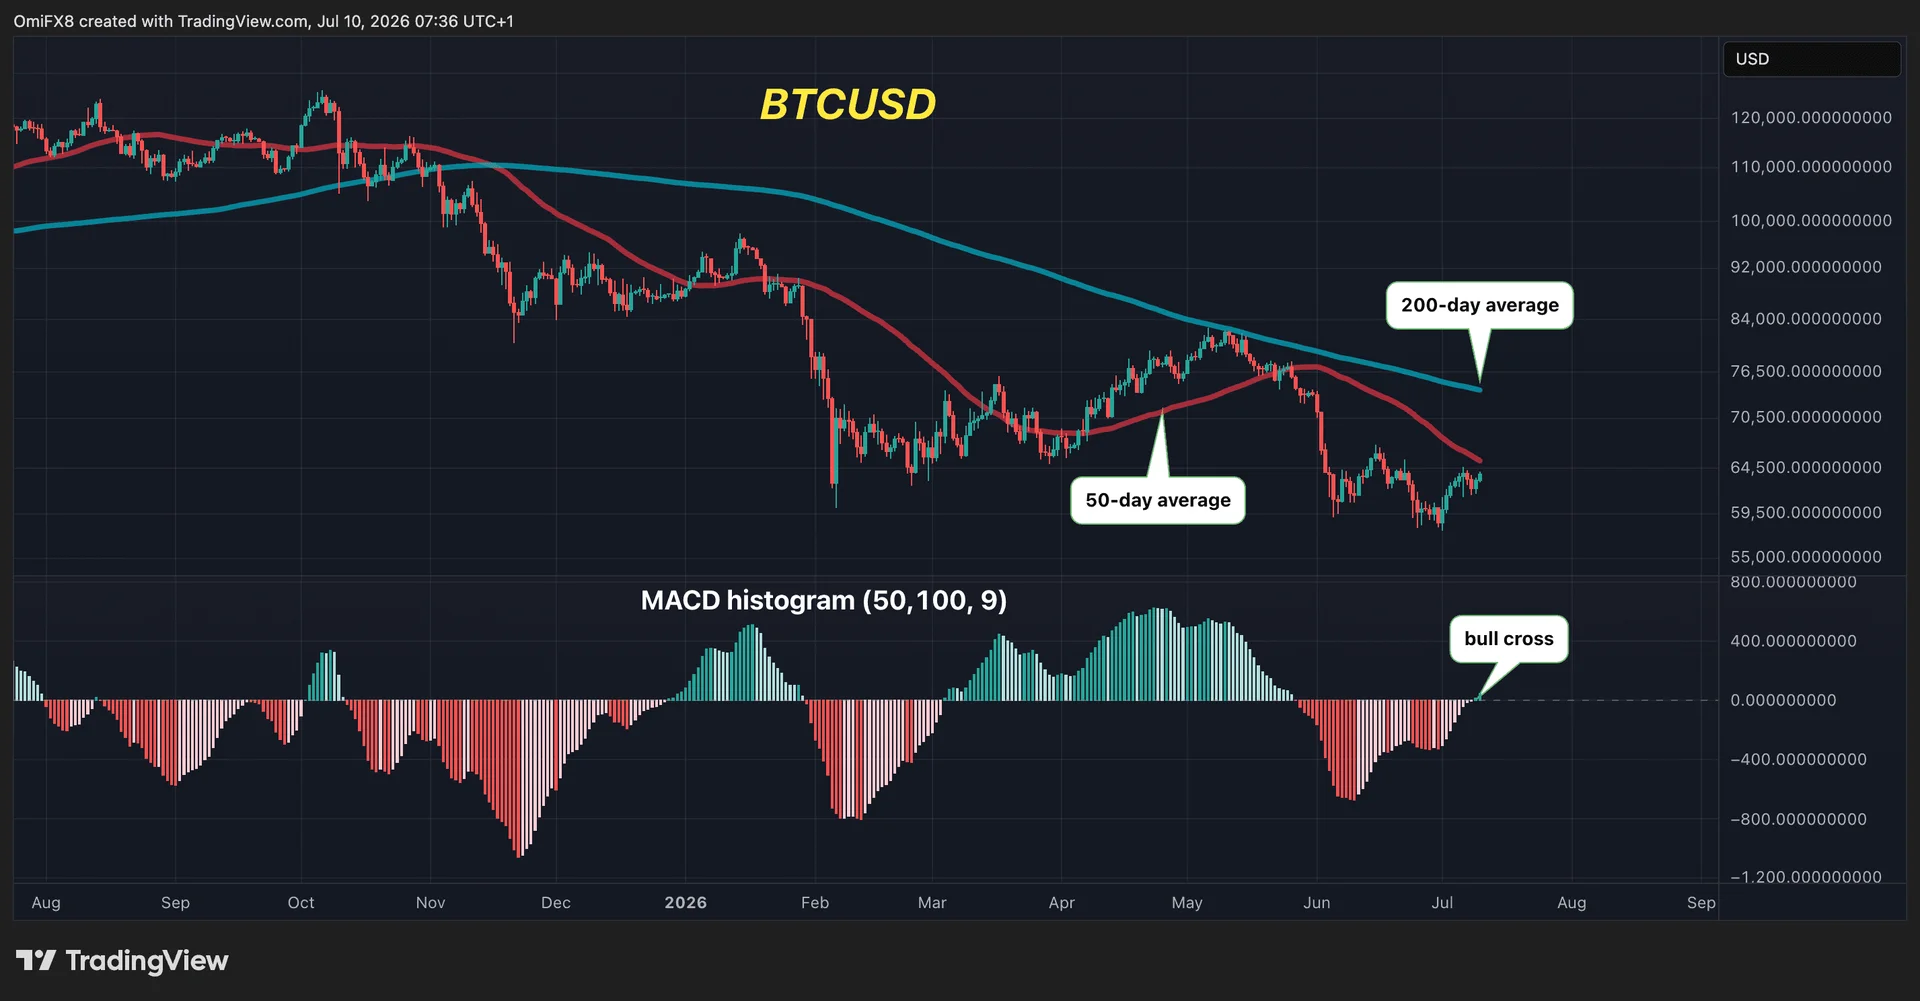

Bitcoin's longer-term MACD histogram crossed above zero this week, flashing a bullish shift in momentum after the rally past $64,000. The signal comes from a less noisy variant of the moving average convergence divergence indicator, which swaps the standard 12/26 settings for 50-day and 100-day inputs against a 9-day signal line, a configuration traders use to filter out short-term flip-flops.
Historically, this MACD has been a reliable standalone gauge through Bitcoin's drawdown from its $126,000 record. Since October, every negative crossover has marked the start of a steeper leg lower, while positive crossovers preceded the December-January recovery and the February-May rally. The latest bullish turn therefore points to a notable bounce, though not yet confirmation of a full-blown new uptrend.
Why it matters
The cross is the kind of signal that doesn't fire often, and its track record through the recent downtrend is what makes it worth watching now rather than treating it as background noise. Bitcoin trading just above $64,000 sits below all three resistance zones analysts have flagged, which means the indicator's optimism is forward-looking rather than already priced in. Confirmation still has to come from price action through the levels that have rejected every prior attempt this quarter.
Market impact
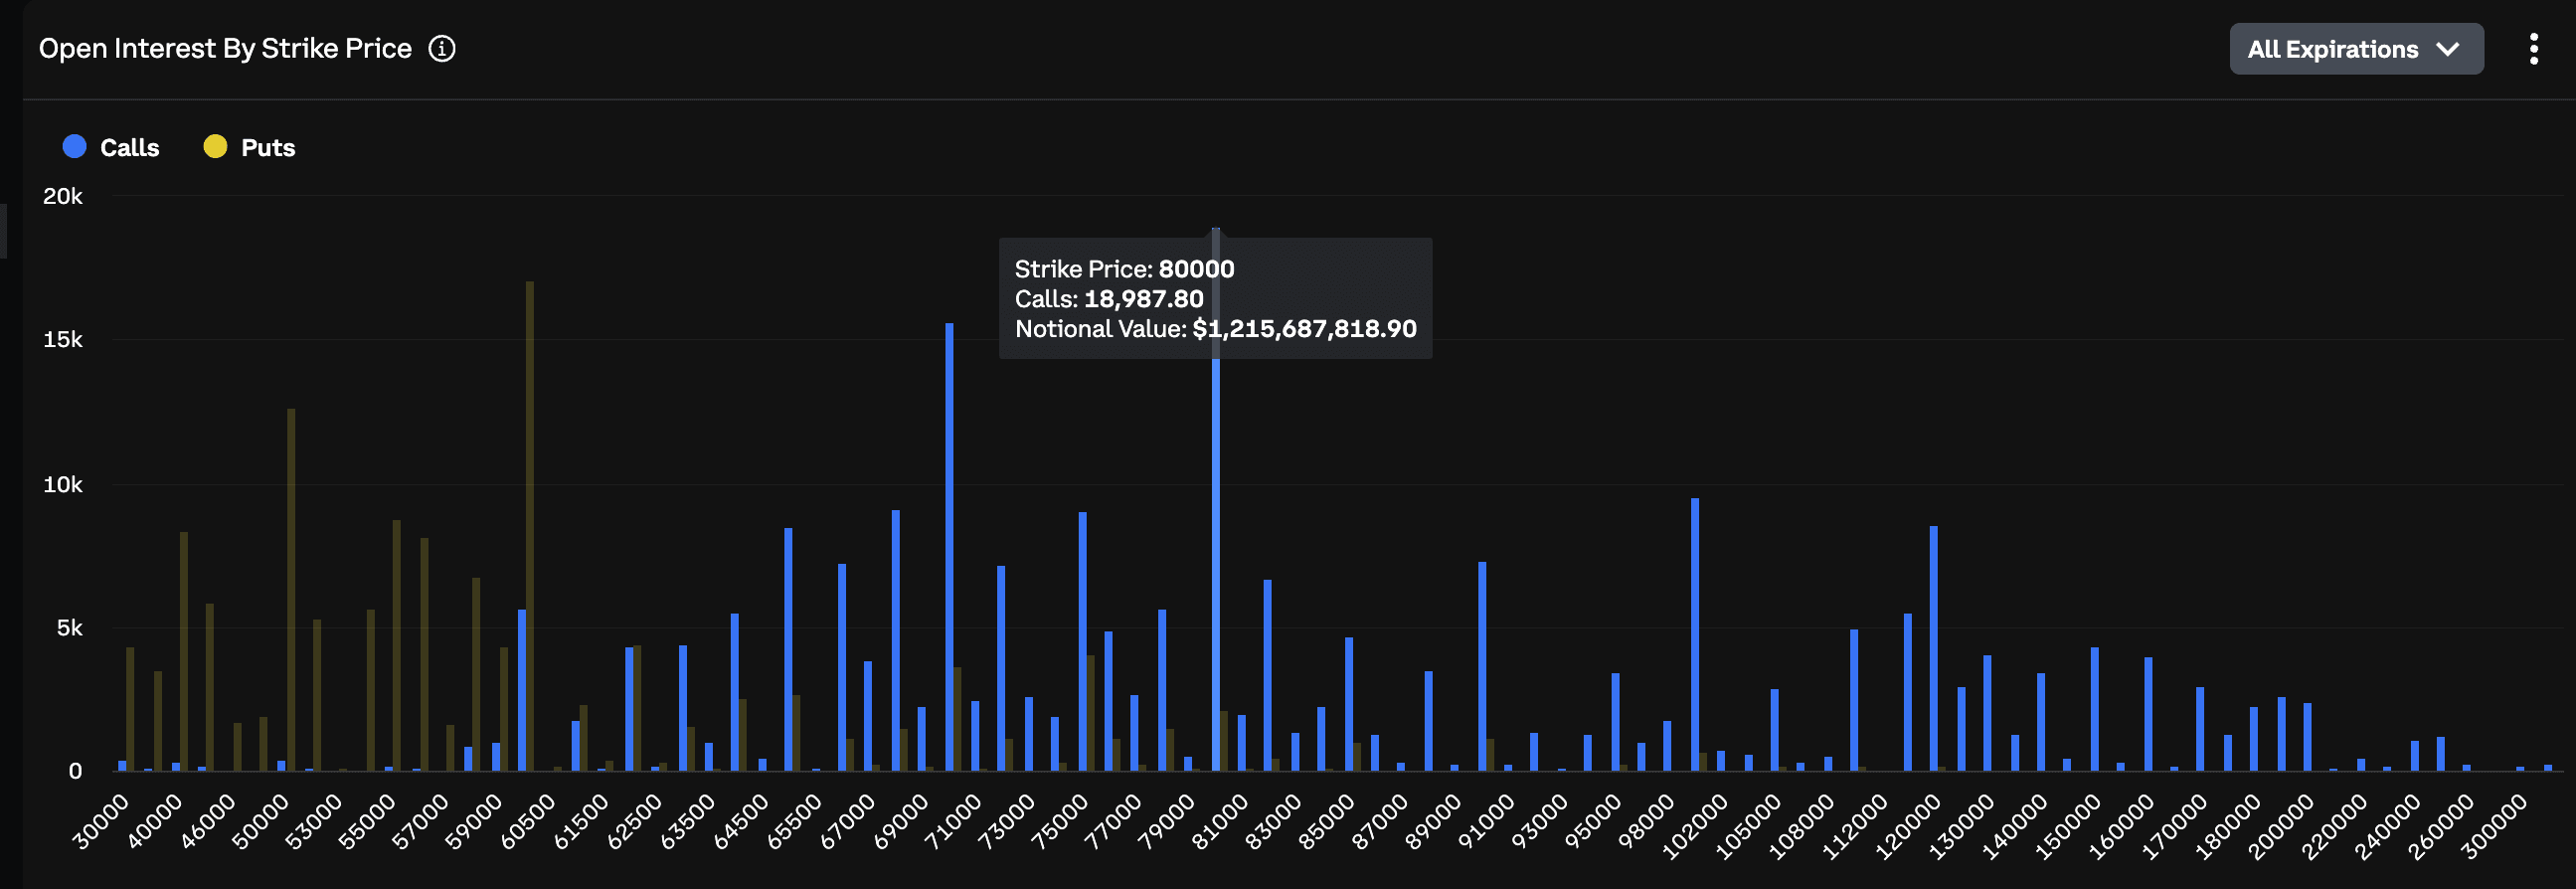
The first hurdle is the 50-day simple moving average around $65,434, then the mid-June high at $67,292, where sellers stepped in aggressively. The decisive test is the 200-day moving average near $71,147, which capped the May rebound and remains the line between a relief bounce and a confirmed structural uptrend. Beyond spot, Deribit options data shows $1.21 billion in notional open interest stacked at the $80,000 strike, the highest on the exchange, a pool that will likely amplify swings as price approaches that zone.

Frequently asked questions
-
Which MACD settings is the article referring to?
A longer-term variant using 50-day and 100-day moving averages against a 9-day signal line, rather than the standard 12/26/9 configuration that produces more short-term noise.
-
How has this MACD performed through Bitcoin's recent drawdown?
Since October, every negative crossover has marked the start of a steeper decline, while positive crossovers preceded the December-January and February-May recovery rallies, giving the indicator a reliable track record as a standalone gauge.
-
What is the first resistance level Bitcoin needs to clear?
The 50-day simple moving average near $65,434, which traders watch as a near-term momentum gauge.
-
Why is the 200-day moving average near $71,147 so important?
It is one of the most widely followed long-term trend indicators and acted as major resistance in early May, stopping the rebound from February lows. Clearing it convincingly would be strong evidence that a full bullish trend is developing.
-
How could the $80,000 level affect Bitcoin's price?
Deribit options data shows more than $1.21 billion in notional open interest at the $80,000 strike, the highest on the exchange. Hedging activity around that strike could spill over into spot and futures as price approaches, adding to volatility.
 Lookonchain
 CoinTelegraph
 CryptoSlate
 TheBlock
 Crypto Rank News
 Benjamin Cowen