 CoinDesk

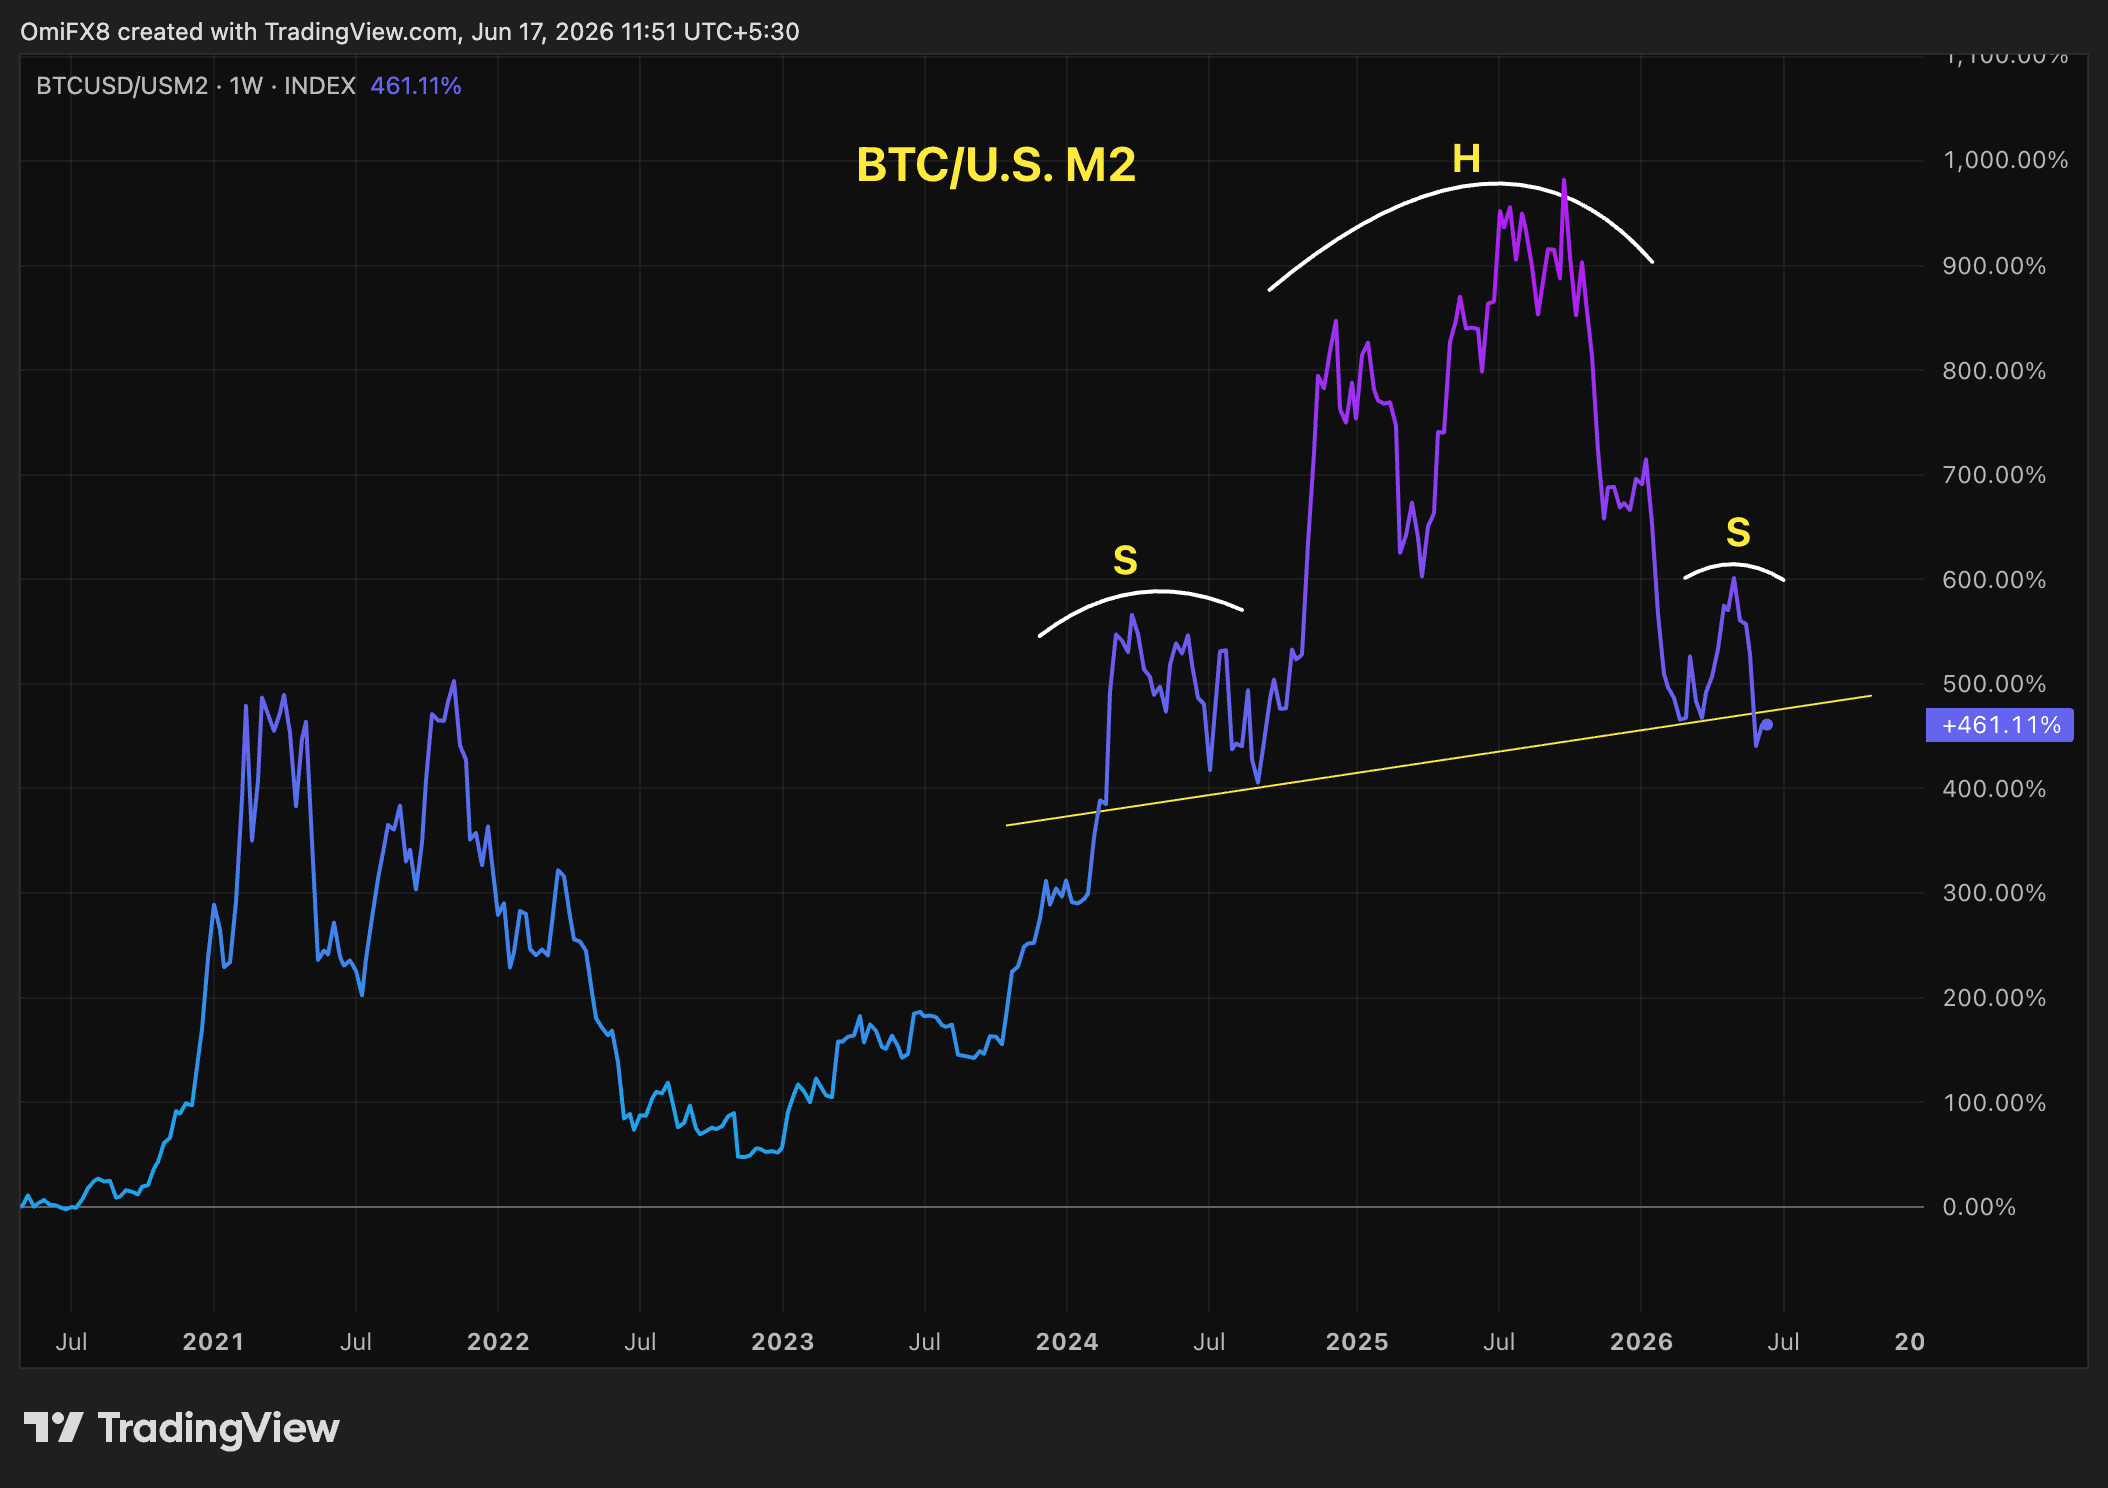

Bitcoin's price, adjusted for U.S. M2 money supply growth, has formed what technical analysts call a head-and-shoulders pattern — a configuration typically read as a bearish reversal. The BTC/M2 ratio climbed sharply from 2023 through 2025 before rolling over, a signal that bitcoin's ability to outpace the flood of new dollars may be approaching diminishing returns. With BTC now near $66,000 — down from roughly $126,000 in October — the nominal decline looks like a familiar crypto bear cycle, but the M2-adjusted view reframes it as something more structural.
Why it matters
Bitcoin has long been treated by some observers as a high-beta barometer for dollar liquidity, and the BTC/M2 ratio is the cleanest expression of that thesis. A breakdown would mean the asset that historically front-ran monetary expansion is losing that edge. That matters beyond crypto: bitcoin has at times been viewed as a leading indicator for broader risk appetite, so a deteriorating M2-adjusted reading is potentially an early warning for traditional risk assets too.
Market impact
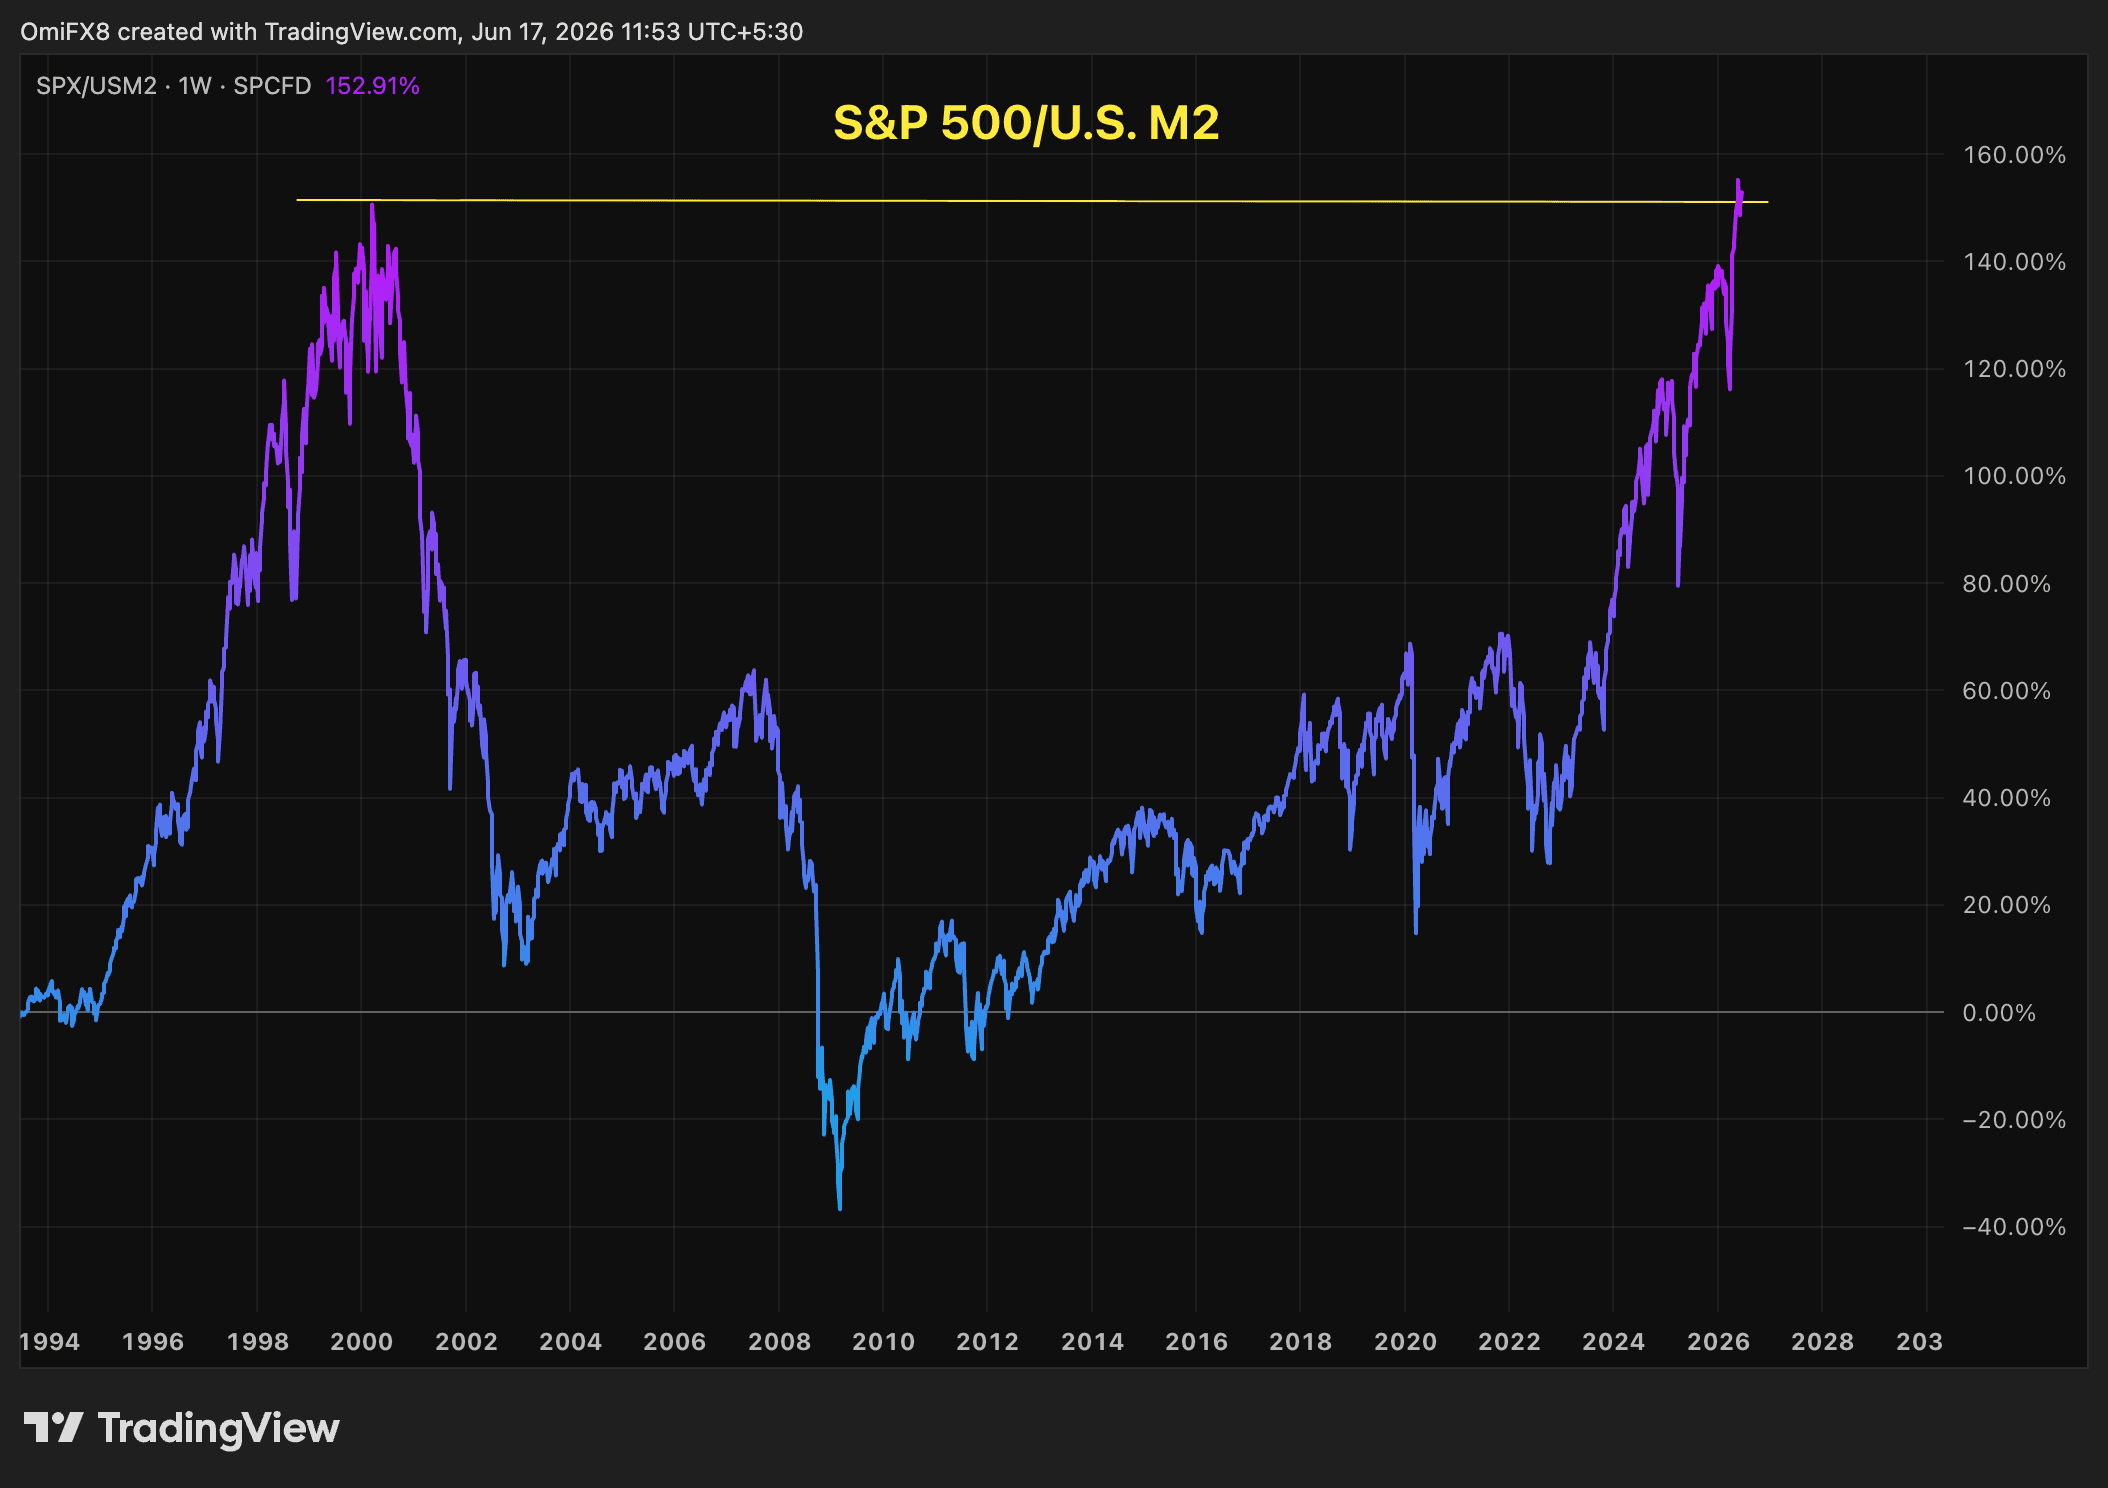
The S&P 500 makes the same point from a different angle. The index sits near a record nominal high of 7,511 points, well above its 2000 peak of roughly 1,500. Adjust those levels for two decades of M2 growth, however, and the S&P has only recently reclaimed its dot-com-era monetary-adjusted valuation. Corporate earnings are stronger and more durable than 1999-2000, so the comparison isn't one-for-one, but the math is sobering: every new dollar added to the system has had to work harder for a relatively smaller marginal gain in valuation. If the most liquidity-sensitive asset in the room is losing its structural battle against the dollar supply, the rest of the risk-on complex is at least worth a moment of caution.

Frequently asked questions
-
What is the BTC/M2 ratio?
The BTC/M2 ratio is bitcoin's price divided by the U.S. M2 money supply, a metric some analysts use to strip out the effect of dollar debasement and isolate bitcoin's true price performance against monetary expansion.
-
Why is a head-and-shoulders pattern bearish?
A head-and-shoulders pattern is a technical chart formation with three peaks — a higher middle peak flanked by two lower ones — typically read as a sign that an uptrend is losing momentum and a reversal to the downside may follow.
-
How has the S&P 500 performed on an M2-adjusted basis?
On an M2-adjusted basis, the S&P 500 has only recently reclaimed the monetary-adjusted valuation it hit at the height of the dot-com bubble in 2000, despite nominal highs now more than five times that peak level.
-
Does M2-adjusted weakness mean equities will drop?
Not necessarily — corporate earnings today are generally considered stronger and more durable than in 1999-2000, so an M2-adjusted comparison doesn't directly map to overvaluation in the same way it did during the dot-com era.
-
Why does the BTC/M2 ratio matter for traditional markets?
Bitcoin has at times been treated as a leading indicator for broader risk appetite because it is highly sensitive to dollar liquidity; a deteriorating BTC/M2 reading is therefore read by some observers as an early warning for the rest of the risk-on complex.