








 CoinDesk
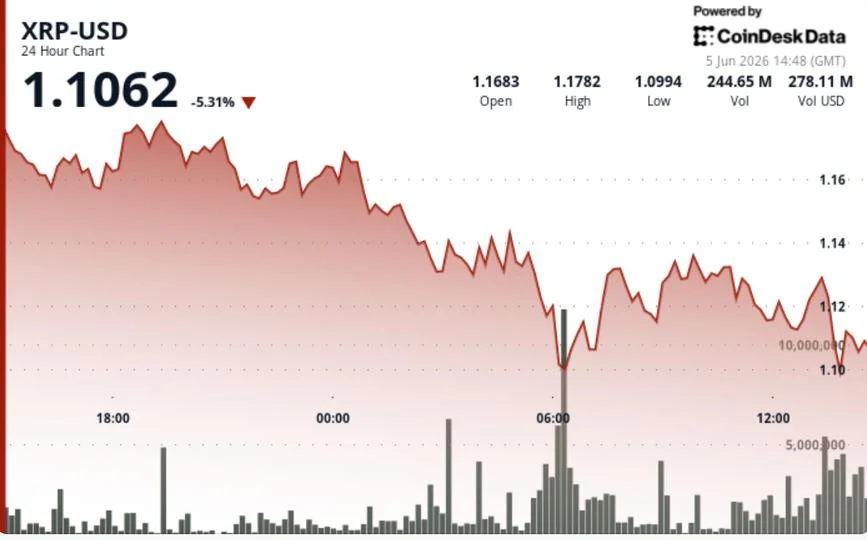


XRP fell toward $1.10 over the 24-hour session, sliding to its weakest level in months as liquidation-style selling overwhelmed support near $1.20 and dragged the token briefly below $1.09 before dip buyers stepped in. The single sharpest move came during the June 5 06:00 UTC window, when volume spiked to 268.2 million XRP and accelerated the breakdown through the prior consolidation zone. Price recovered modestly into the $1.11 area, but a failed rally toward $1.133 reversed sharply, leaving sellers still in control of the structure.
Why it matters
The pattern matters more than the print. Volume of that scale rarely shows up in orderly profit-taking — it is the signature of leveraged positioning being forced out, and the breakdown converted what had been a $1.20-$1.25 buying zone into fresh supply. The $4 million in fresh XRP ETF inflows and roughly $1.5 billion in cumulative inflows could not offset the broader capitulation: XRP slipped below USDC in market-cap rankings, dropping under $75 billion, and the crypto Fear & Greed Index slid into extreme fear as traders priced in macro uncertainty following a hot US jobs print.
Market impact
The chart now frames a clean two-level test. $1.09-$1.10 is the most important support zone — losing it shifts the focus to the $0.92 area several analysts had flagged. $1.12-$1.13 is the first level bulls need to reclaim with volume before any stabilization narrative gains credibility. Weekly RSI touched one of the most oversold readings in years, a level that has historically appeared near major cycle lows, but oversold conditions can persist through liquidation-driven declines longer than traders expect. A durable bottom will likely need stronger volume on rebounds than on the selling that preceded them — something the tape has not yet delivered.

Frequently asked questions
-
Why did XRP fall toward $1.10?
XRP slid on liquidation-style selling that overwhelmed support near $1.20, with volume spiking to 268.2 million XRP during the June 5 06:00 UTC session before dip buyers emerged near $1.09.
-
What levels are analysts watching on the XRP chart?
Analysts see $1.09-$1.10 as the most important support zone, with a break below opening a path toward $0.92. $1.12-$1.13 is the first recovery level bulls need to reclaim with volume.
-
Did XRP ETF inflows support the price?
Roughly $4 million in fresh XRP ETF inflows, and cumulative inflows near $1.5 billion, were not enough to offset the broader selloff, which dragged the token below USDC in market-cap rankings.
-
Is XRP oversold and ready to bounce?
Weekly RSI touched one of the most oversold readings in years, a level that has historically appeared near major cycle lows. However, oversold conditions can persist through liquidation-driven declines longer than traders expect.
-
What would signal a durable bottom for XRP?
Traders are looking for stronger volume on rebounds than on the selling that preceded them, a reclaim of $1.12-$1.13 with conviction, and evidence that former support levels are turning back into support rather than resistance.
 Crypto News
 Glassnode
 WatcherGuru
 WuBlockchain
 Lookonchain
 Crypto Capital Venture