 CoinDesk
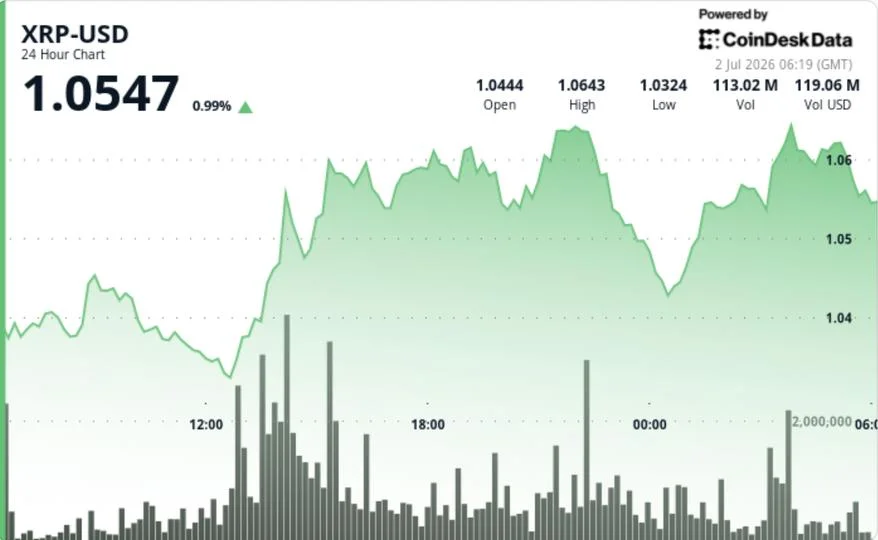


XRP is putting together a quiet accumulation story above the $1.00 support area. The token added 1.41% to $1.0613 in the 24-hour session ending July 2, breaking out above the $1.0560 zone on a volume spike of 5.34 million (a 1,433% jump from the prior hourly average) before running into resistance near $1.0665. Under the surface, the network is showing the strongest activity it has seen in months: the XRP Ledger logged 4,941 new wallet creations in a single day, the highest daily figure in more than three months, while CryptoQuant's All CEX Whale vs Retail Spread climbed to 50.9% (44.6% on Binance), the kind of reading that signals large holders are doing more of the buying while retail stays sidelined.
Why it matters
The institutional wrapper around XRP is also thickening. XRP spot ETFs pulled in $15.34 million in net inflows on June 29, with Bitwise alone accounting for $11.94 million of that total. June inflows across XRP ETFs surpassed $62 million, lifting cumulative net flows to roughly $1.48 billion. New wallets at a three-month high, whales leading the bid, and steady ETF demand landing in the same window is the kind of stack that, on its own, would normally be read as a recovery setup. The reason traders are still hesitant is the chart: XRP remains below its 20-day EMA near $1.11, the 50-day near $1.20, the 100-day near $1.31 and the 200-day near $1.52, and RSI near 33 with negative Chaikin Money Flow shows buyers have not fully taken control.
Market impact
The trade is therefore a support-defense story, not a confirmed trend shift, until $1.10 gives way. The immediate setup: $1.0560–$1.0590 is the breakout zone bulls need to hold, $1.0665 is the first resistance above, and a clean reclaim of the $1.10–$1.11 band (where the 20-day EMA and Bollinger midline sit) would shift attention toward $1.20. A failure to defend $1.04 puts the $1.00 support area squarely back in focus.

Frequently asked questions
-
Why is XRP whale activity rising while retail stays cautious?
CryptoQuant's All CEX Whale vs Retail Spread climbed to 50.9% (44.6% on Binance), indicating large holders are absorbing supply while retail participation remains light. The spread widening in this direction typically signals accumulation by deeper-pocketed buyers rather than broad-based demand.
-
How much have XRP spot ETFs taken in recently?
XRP spot ETFs pulled in $15.34 million in net inflows on June 29, with Bitwise accounting for $11.94 million of that total. June inflows across XRP ETFs surpassed $62 million, lifting cumulative net flows to roughly $1.48 billion.
-
What level does XRP need to reclaim to confirm a recovery?
Traders are watching $1.0560–$1.0590 as the immediate breakout zone to defend, $1.0665 as first resistance above, and $1.10–$1.11 as the band where the 20-day EMA and Bollinger midline sit. A sustained close above $1.10 would shift attention toward $1.20; failure to hold $1.04 puts the $1.00 support area back in focus.
-
What is the current XRP price and how did it move?
XRP rose 1.41% to $1.0613 in the 24-hour session ending July 2 at 04:16 UTC, breaking out above $1.0560 on volume of 5.34 million, a 1,433% jump from the prior hourly average. The token still underperformed the broader crypto market by 1.27% over the same window.
-
Is XRP still in an uptrend or just range-bound?
XRP is building higher lows above $1.00, with $1.0318 and $1.0410 forming the base of the latest recovery attempt, but the token remains below its major moving averages (20-day near $1.11, 50-day near $1.20, 100-day near $1.31, 200-day near $1.52). RSI near 33 and negative Chaikin Money Flow show momentum is improving…