 CoinDesk
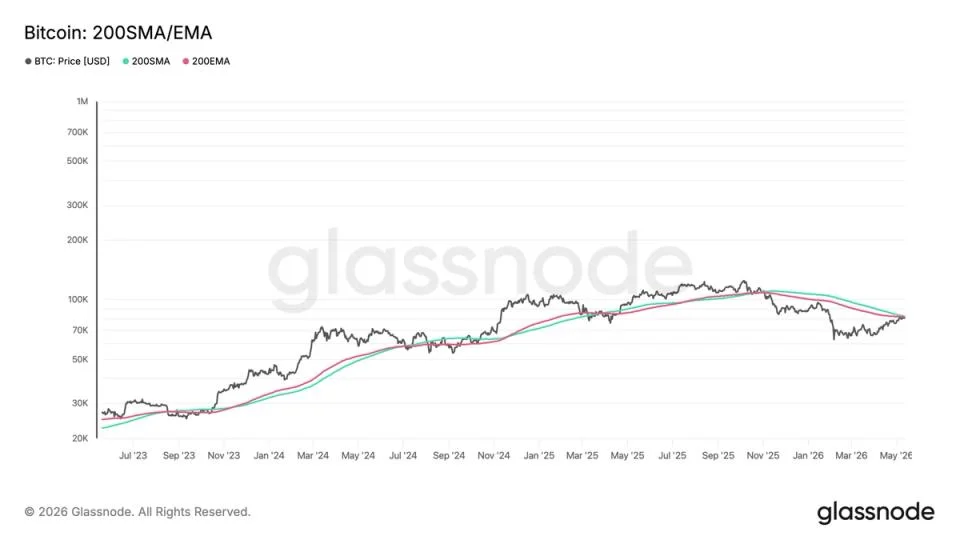


Bitcoin is pressing against the 200-day Simple Moving Average at $82,455 and the 200-day Exponential Moving Average at $82,027, two long-term trend gauges that have converged into a single confluence resistance zone between roughly $82,000 and $82,500. A decisive reclaim of that band is the level bulls need to argue the long-term uptrend has reasserted itself; another rejection hands the structural advantage back to sellers who have controlled the tape since the late-2025 rollover from $108,000.
The setup matters because BTC has not traded above either 200-day average in months. The first loss came in late November 2025 as price rolled over from $108,000, a January recovery attempt stalled near $97,000, and by early February 2026 bitcoin had carved out a $60,000 low. Each bounce since has failed at the 200DMA ceiling, which is why the current test carries more weight than the spot price alone suggests.
Why it matters
The 200SMA and 200EMA are widely tracked institutional trend filters. The 200SMA weights every day in the window equally; the 200EMA gives more weight to recent closes, so when the two cluster within a few hundred dollars — as they do now — they effectively act as one thick resistance band rather than two separate levels.
For most of this cycle, that band has been resistance on every touch. Until bitcoin closes convincingly above $82,500 on a daily or weekly basis, systematic and trend-following capital is likely to treat rallies as selling opportunities into overhead supply rather than the start of a new leg.
Market impact
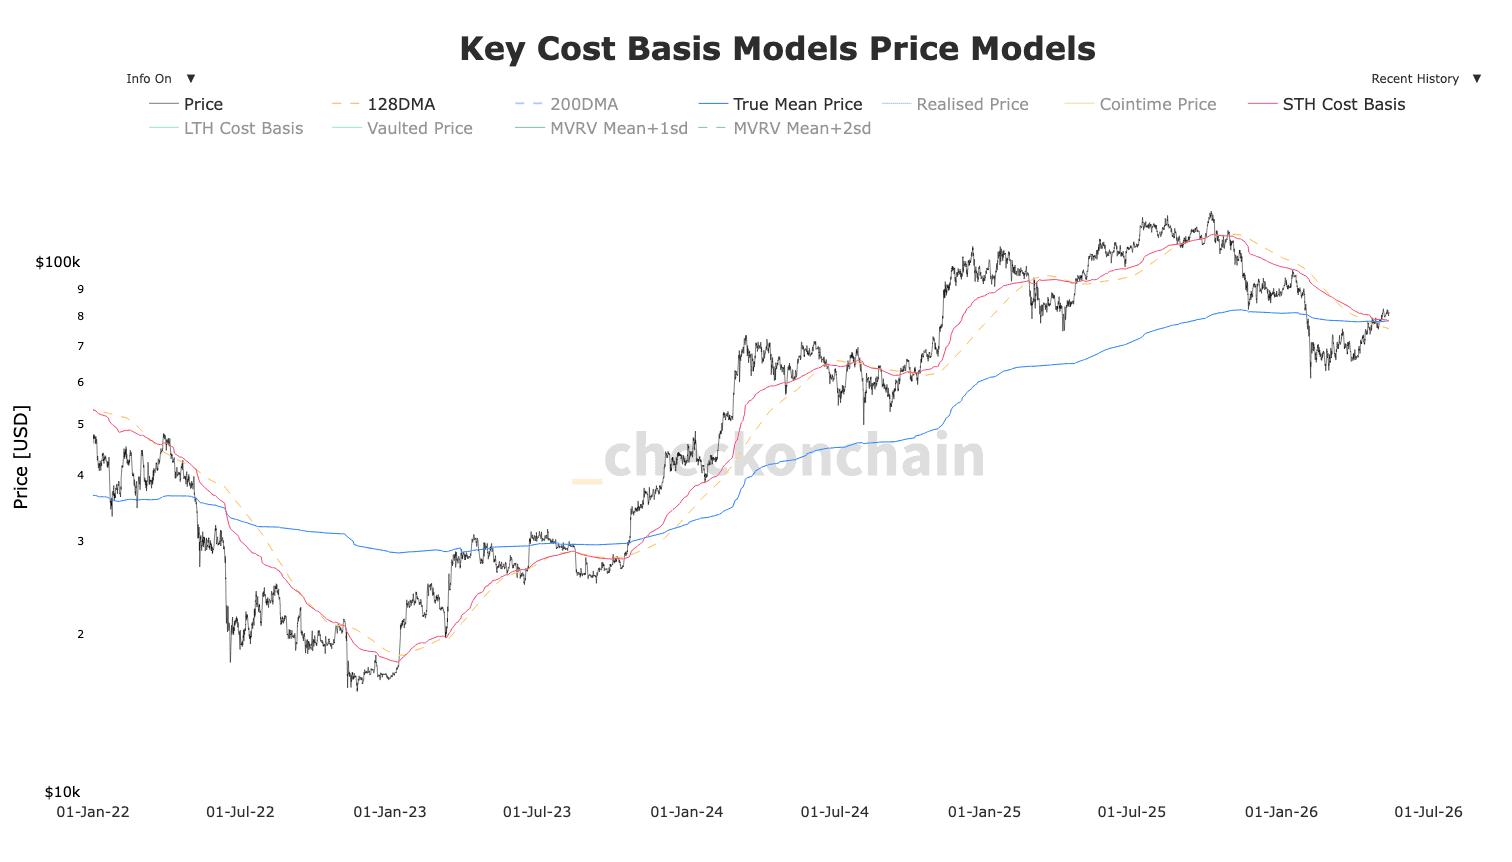
The supportive side of the picture is the cost-basis stack underneath. CheckonChain data shows bitcoin still holding above the 128-day Moving Average at $75,700, the True Market Mean at $78,200, and the Short-Term Holder Cost Basis at $78,400 — levels that, taken together, mean the bulk of recent buyers remain in profit. That reduces the forced-selling pressure that typically builds when a wide swath of the market goes underwater.

Frequently asked questions
-
What are the 200-day SMA and EMA levels bitcoin is testing right now?
Bitcoin is pressing against the 200-day Simple Moving Average at $82,455 and the 200-day Exponential Moving Average at $82,027, which have converged into a single confluence resistance zone between roughly $82,000 and $82,500.
-
Why is the 200-day moving average such a watched level?
The 200SMA and 200EMA are widely tracked long-term trend filters. The 200SMA weights every day in the window equally, while the 200EMA gives more weight to recent closes. When the two cluster tightly, as they do now, they act as one thick resistance band rather than two separate levels.
-
When did bitcoin last lose the 200-day moving average?
Bitcoin first lost the 200DMA in late November 2025 as price rolled over from $108,000. A January 2026 recovery attempt stalled near $97,000, and by early February 2026 BTC had carved out a $60,000 low.
-
Which cost-basis levels is bitcoin still holding above?
CheckonChain data shows bitcoin above the 128-day Moving Average at $75,700, the True Market Mean at $78,200, and the Short-Term Holder Cost Basis at $78,400. With the bulk of recent buyers in profit, forced-selling pressure from underwater holders is currently limited.
-
What would a clean reclaim of $82,500 mean for the trend?
A decisive daily close above the $82,000–$82,500 band would flip that zone into support and reopen the path toward the $97,000 area where January's recovery attempt failed. A rejection from current levels risks a retest of the $78,000 cost-basis shelf and, below that, the $75,700 128DMA.