








 CoinDesk
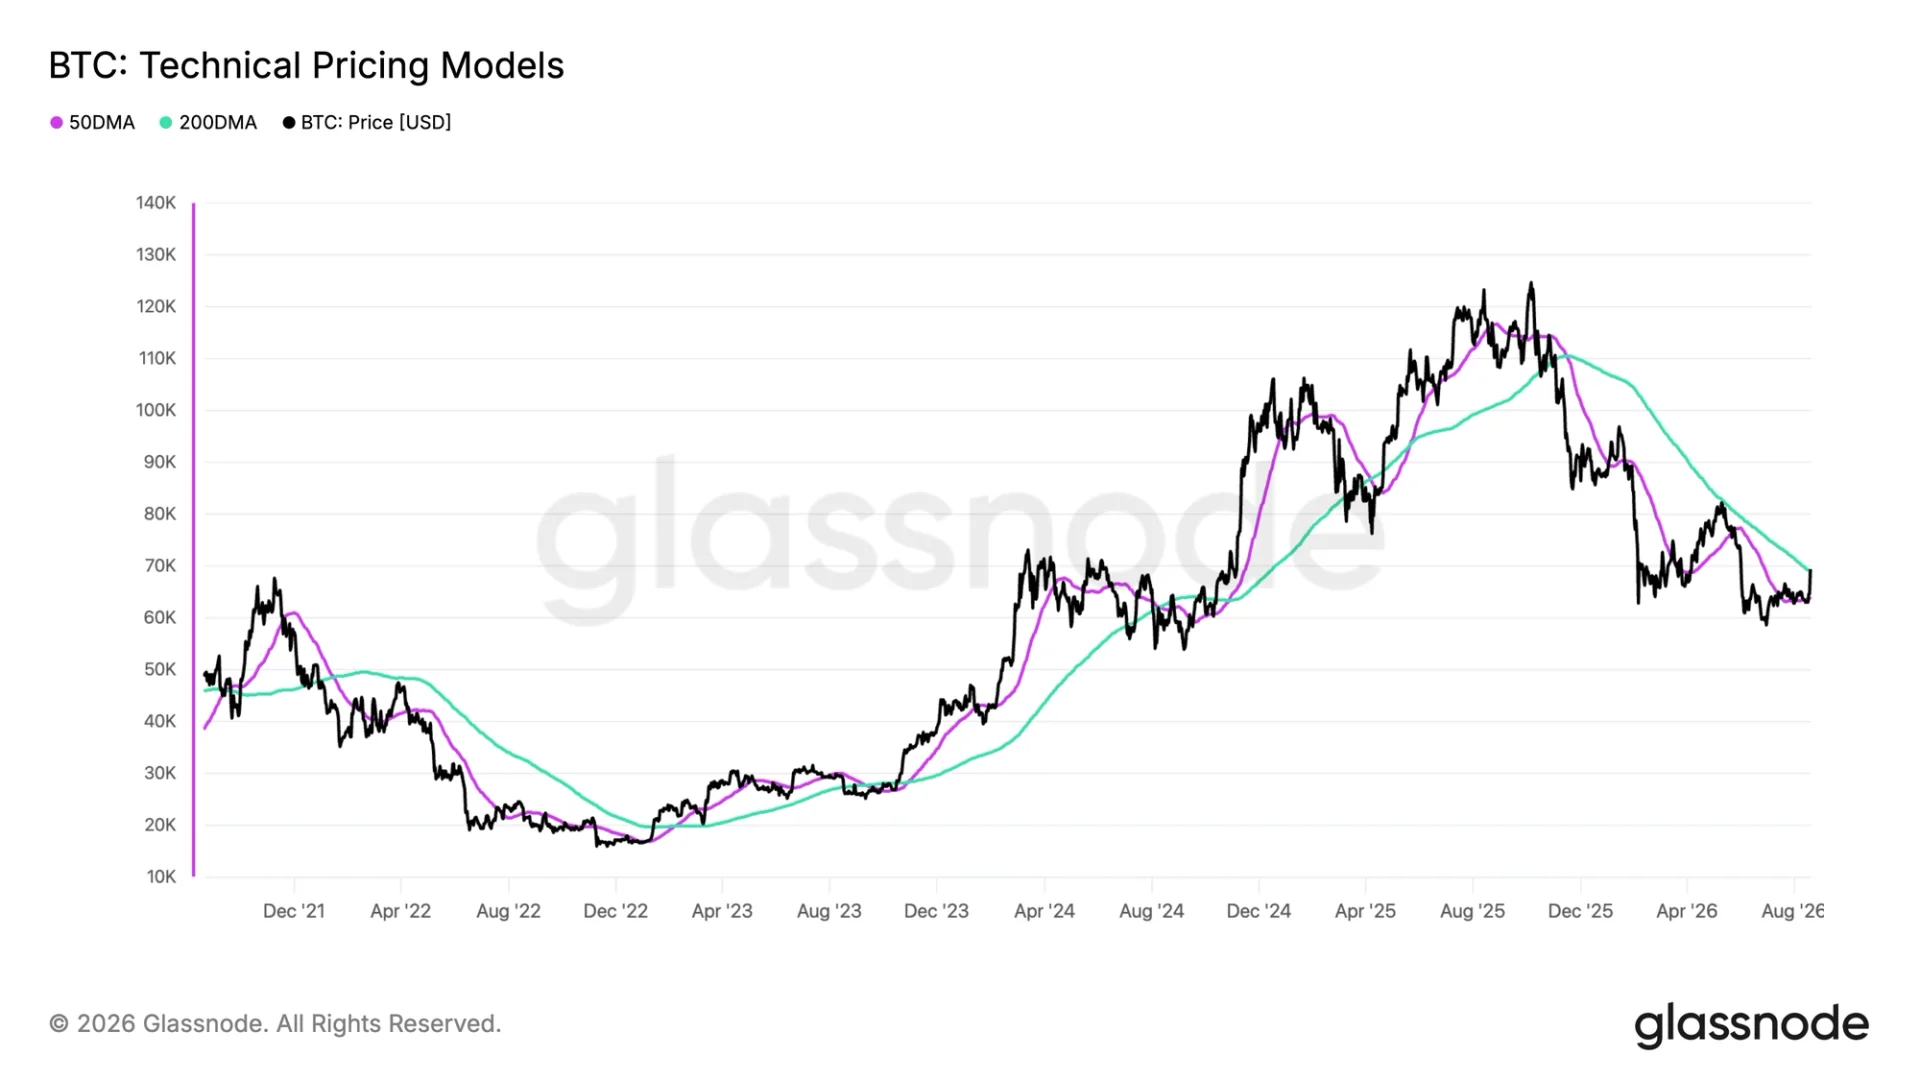


Bitcoin is trading above $71,000 after gaining more than 12% in a week, while its rising 50-day moving average approaches the 200-day SMA. The price has moved above the 200-day average at $69,005, a level widely used to assess Bitcoin's long-term trend. A golden cross would form if the 50-day average crosses above the 200-day average, a pattern widely regarded as a bullish long-term signal.
Why it matters
Bitcoin had traded below its 200-day SMA since October 2025, when its price was roughly $110,000. A sustained move above the average could signal a shift from a bear market to a bull market. The technical signal also lags price action: Bitcoin typically rises before the crossover, so traders waiting for confirmation may miss part of the move.
Golden crosses appeared in February 2023, October 2023, October 2024 and April 2025, and all preceded further rallies in Bitcoin. That history supports the bullish read, but it does not guarantee that the current move will extend.
Market impact
The immediate test is whether Bitcoin can hold above $69,005 while the 50-day average continues to rise. A decisive move back below the 200-day SMA would weaken or invalidate the case that Bitcoin's longer-term trend has turned bullish.
Until the averages cross, this remains a developing setup rather than a confirmed golden cross. The market is weighing a potential trend reversal against the possibility that the move is only a relief rally.

Frequently asked questions
-
What has to happen for Bitcoin to form the golden cross?
The rising 50-day moving average must cross above the 200-day moving average. That crossover has not formed yet.
-
What level is the key test for Bitcoin's developing trend reversal?
Bitcoin needs to hold above its 200-day SMA at $69,005. A decisive move below that level would weaken or invalidate the case that the longer-term trend has turned bullish.
-
Why can traders miss part of a move before the crossover?
Bitcoin typically rises before the crossover occurs, so traders who wait for moving-average confirmation can miss part of the move.
-
Which earlier Bitcoin golden crosses preceded further rallies?
Earlier crossovers occurred in February 2023, October 2023, October 2024 and April 2025. All preceded further rallies in Bitcoin's price.
-
Could Bitcoin's current rally still be a relief move?
The move could be a relief rally rather than a sustained uptrend. A decisive break below $69,005 would weaken or invalidate the bullish case.
 Benjamin Cowen
 Crypto Capital Venture
 Crypto News
 WatcherGuru
 CryptoSlate
 TheBlock
 WuBlockchain
 Glassnode
 CoinTelegraph