


 CoinDesk
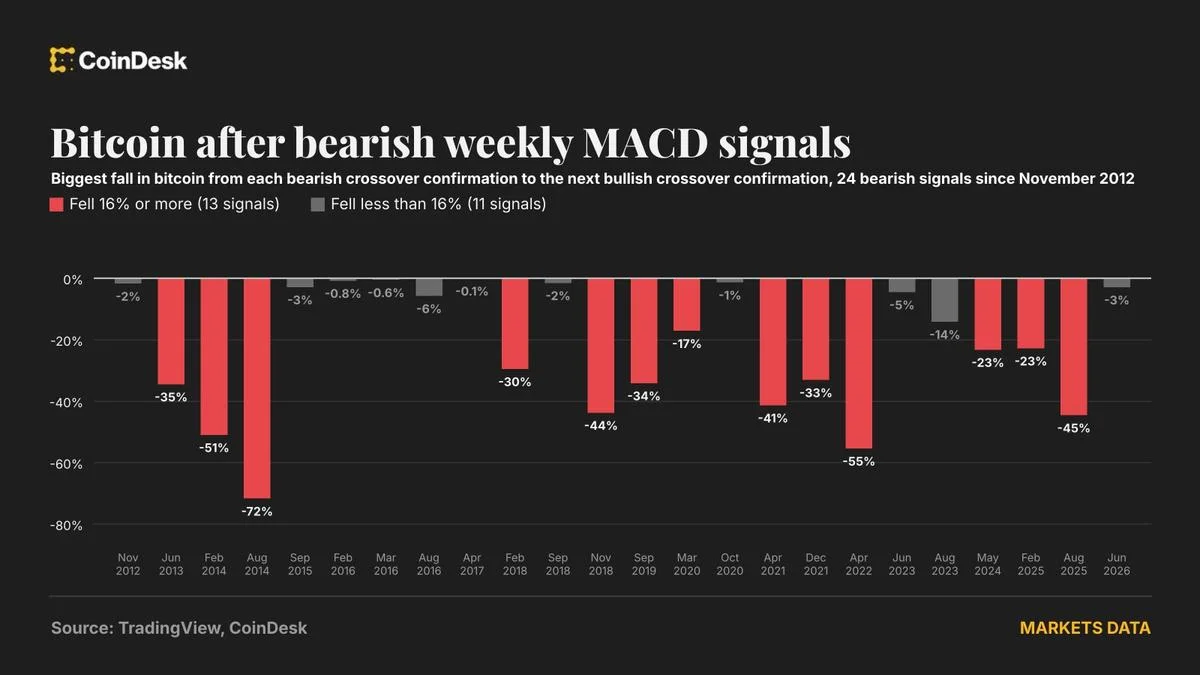


Bitcoin's weekly MACD histogram has dipped below zero for the first time in this cycle, a bearish momentum shift that would be confirmed if the bar stays negative at Sunday's weekly close. The technical warning lands with BTC hovering near its 200-week average and having already slipped below $70,000 for the first time since August, as the U.S. Dollar Index hit a 19-month high.
"Bitcoin is headed lower. The technical indicators are flashing clear red signals. Weekly MACD rolling over with Bear Cross," said Josh Taylor, founder of analytics firm 7th Key Financial, on X. Several other observers echoed the warning, cautioning against expecting a quick bottom.
Why it matters
The historical record behind this indicator is sobering. Since November 2012, the weekly MACD has turned bearish 24 times, and in 13 of those instances, roughly half, bitcoin fell at least 16% from the price at confirmation before the MACD flipped back positive. The slides were often fast: five of the 13 hit the 16% mark within a single week, 10 within four weeks, and the median was three weeks. In November 2018, BTC slumped 38% in one week; in February 2014 it lost 35%.
The worst cases, including the August 2014 and April 2022 signals, saw bitcoin lose more than half its value. But the indicator is not a guarantee: 11 signals produced smaller declines, and the most recent one, in June, was followed by just a 3% dip to around $57,700 before a rebound.
Market impact
A repeat 16% slide from current levels would take BTC back toward its 2026 low near $57,700, the same level that held in June. The setup is complicated by flows: institutions are pulling capital out of spot ETFs while a strong dollar weighs on risk assets broadly. Traders will watch Sunday's weekly close for confirmation, and the $57,700 level as the line that validates or breaks the bearish read. As CoinDesk's analysis notes, no indicator is fully reliable on a standalone basis, and past performance does not guarantee future results.


Frequently asked questions
-
What does the weekly MACD histogram turning negative mean for bitcoin?
The MACD histogram measures momentum, and a dip below zero signals that bearish momentum has overtaken bullish momentum on the weekly timeframe. The signal is confirmed if the bar remains negative at Sunday's weekly close.
-
How reliable is the bearish MACD signal historically?
Since November 2012 the indicator turned bearish 24 times, and in 13 of those instances bitcoin fell at least 16% from the price at confirmation. However, 11 signals produced smaller declines, so it is far from infallible.
-
How fast have past MACD-driven bitcoin selloffs played out?
Often quickly. Five of the 13 major declines reached the 16% mark within a week of the confirmed signal, 10 within four weeks, and the median was three weeks. The November 2018 signal preceded a 38% one-week slump.
-
What price levels should bitcoin traders watch now?
A 16% slide from current levels would put bitcoin's 2026 low near $57,700 in play, the same level that held in June after the last bearish signal produced only a 3% dip before a rebound. BTC is already trading below $70,000.
-
What other factors are weighing on bitcoin beyond the MACD?
Institutions are pulling capital out of spot bitcoin ETFs, and the U.S. Dollar Index has hit a 19-month high, creating a headwind for risk assets. Bitcoin's dip below $70,000 also triggered heavy futures liquidations.
 CryptoSlate
 Benjamin Cowen
 Crypto Capital Venture
 Crypto News