








 Glassnode
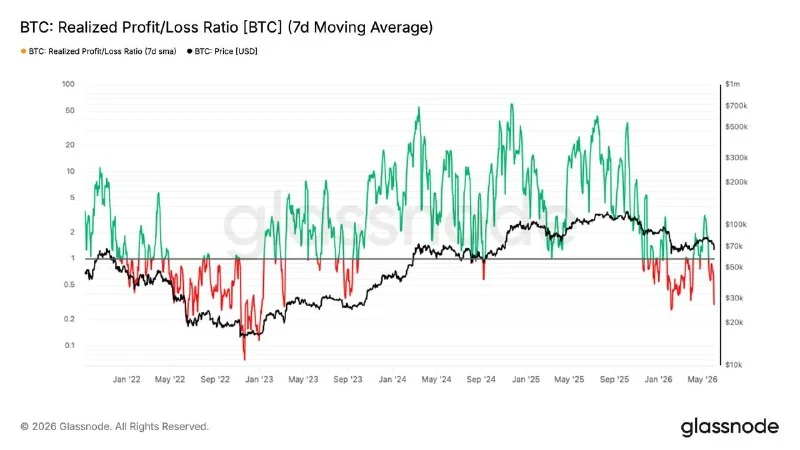
Bitcoin has fallen 13% over the past week to roughly $67,000, dragging profitability metrics back into panic-era territory. The 7-day SMA of the Realized Profit/Loss Ratio collapsed from a local top of 3.16 at the $82K high to 0.29 today, mirroring the February capitulation wave, while the 90-day SMA never breached the 2 threshold that genuine bull regime transitions require. Total Realized Loss has spiked to $1.35B per day, with $770M of that coming from long-term holders distributing cycle-top positions. Spot ETF outflows have run $4.21B over three weeks — the largest institutional redemption streak of 2026 — and the rejection at the aggregate ETF cost basis near $83K has placed the average ETF investor back into an unrealized loss.
Why it matters
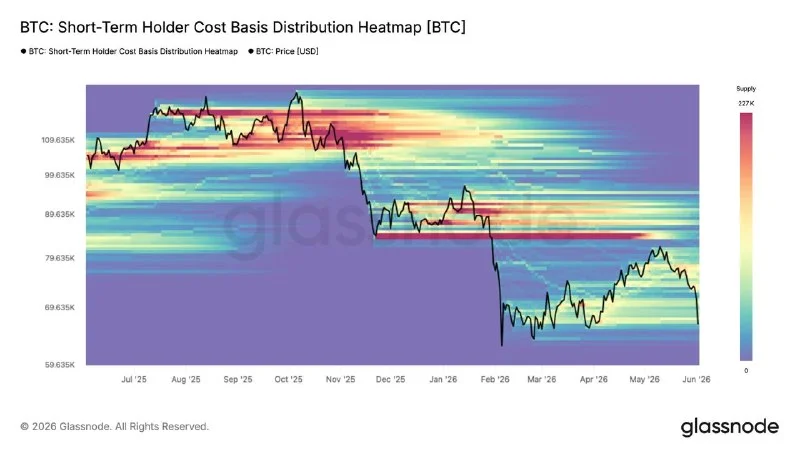
The macro backdrop has tightened the screws. US job openings jumped to 7.62 million in April, 750K above consensus, pushing the 10-year yield back above 4.45% and forcing markets to reprice to a >50% probability of a Fed rate hike by year-end with no cuts remaining. The DXY holds above 99 and financial conditions are tightening at the margin, not easing. Bitcoin has absorbed this shift harder than any other risk asset, and the on-chain structure now reflects that. The Short-Term Holder Cost Basis at $76.4K has fallen below the True Market Mean at $77.8K for the first time since January 2022 — a configuration associated with later-stage bear markets where the time component of the drawdown starts to weigh on investor conviction and structural failures become more common.
Market impact
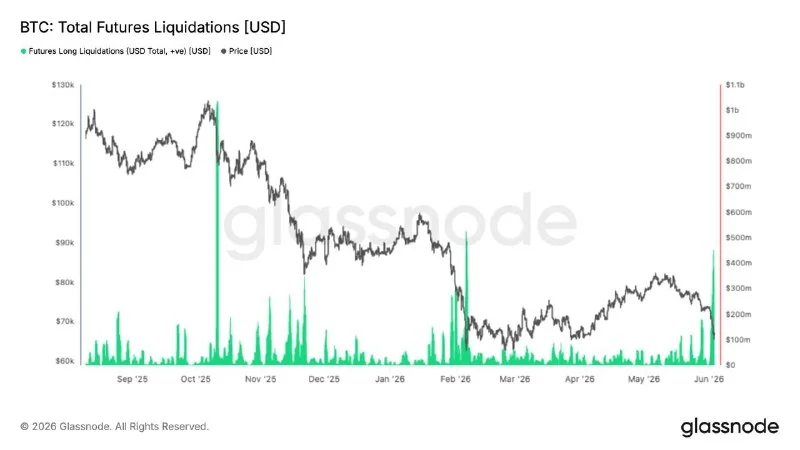
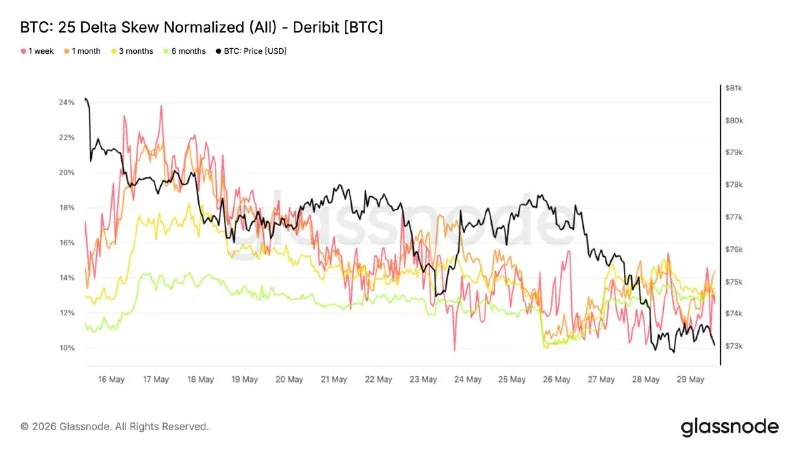
The $82K rally now reads as a bear bounce: short-term capital flows briefly went vertical before collapsing, and the failure to sustain above the True Market Mean at $77.8K reconfirms the prevailing regime. Spot order flow has flipped decisively negative on the 7-day delta, with sellers dominating books at levels not seen since February, and the rejection at the $83K aggregate ETF cost basis has converted prior support into overhead resistance. The $400M in leveraged long liquidations cleared some positioning, but the magnitude sits below the October 2025 and February 2026 wipeouts, meaning leverage was not as extended heading in. In options, implied volatility has compressed even as the volatility risk premium widened toward a three-month high, with put skew holding at 13-14% across the curve and dealer gamma sitting directly under spot at $65-70K — a zone where hedging flows can amplify short-term moves.

Frequently asked questions
-
How far has Bitcoin fallen this week?
Bitcoin has declined roughly 13% over the past seven days, pulling price back to approximately $67,000 from a local high near $82,000.
-
What does the Realized Profit/Loss Ratio collapse signal?
The 7-day SMA fell from a local top of 3.16 at the $82K high to 0.29, indicating loss realization is heavily dominating spending activity. The 90-day SMA never breached 2, confirming the rally lacked structural conviction and was a bear bounce, not a regime change.
-
Why are ETF investors back underwater?
Bitcoin's rally stalled almost exactly at the aggregate US spot ETF cost basis near $83K, converting prior support into resistance and placing the average ETF investor into an unrealized loss. Spot ETFs have recorded $4.21B in outflows over three weeks, the largest streak of 2026.
-
What does the Short-Term Holder Cost Basis dropping below the True Market Mean imply?
The configuration, last seen in January 2022, indicates new buyers are accumulating below the market's key mean valuation. Historically, it marks later-stage bear market conditions where the time component of the drawdown begins to weigh on conviction and structural failures become more common.
-
What is the next major catalyst for Bitcoin?
Friday's US nonfarm payrolls report is the key data point. A strong print extends current distribution pressure and macro headwinds, while a soft number offers the first conditions for a reset in risk assets including Bitcoin.
 CryptoSlate
 WatcherGuru
 Lookonchain
 Crypto News
 CoinDesk
 Crypto Rank News
 WuBlockchain
 Whale Alert