 CoinDesk
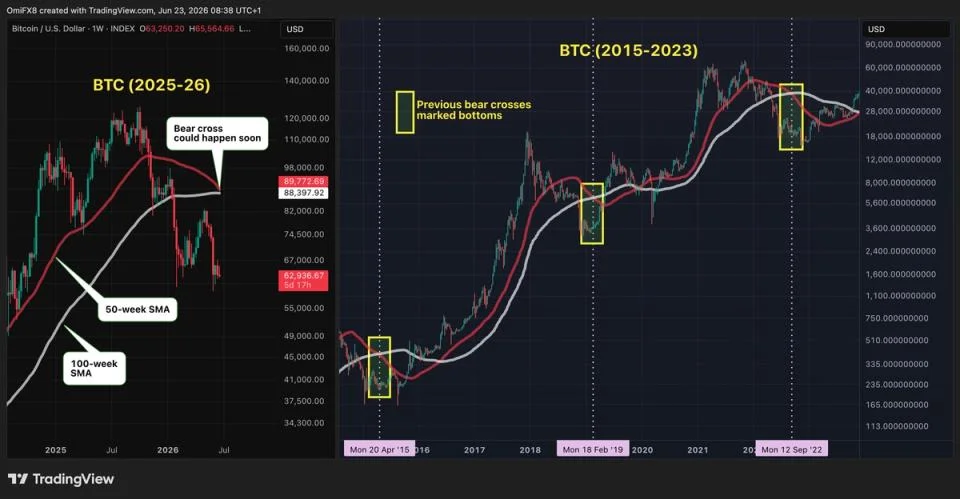


Bitcoin's 50-week simple moving average sits roughly $370 above the 100-week average, putting the pair within days of a "bear cross" that has historically marked cycle bottoms rather than breakdowns. At writing, BTC traded near $62,400, the 50-week SMA at $89,771, and the 100-week SMA at $88,397, with the crossover penciled in for as soon as next week.
The bearish label is a mechanical artifact of the price action that already happened: a roughly 50% drawdown from $126,000 in October to nearly $60,000 has dragged the shorter average toward the longer one. By the time the cross prints, short-term speculators have typically exited and capitulation has already cleared the froth, which is why the signal tends to coincide with exhaustion rather than continuation.
Why it matters
Three prior bear crosses in Bitcoin's history have each marked a market bottom and the start of a roughly three-year rally. The implication is that the lagging nature of the indicator is the thesis: ultra-long-duration moving averages confirm that the prior trend is over before anyone wants to call it. Critics rightly point out that three instances are a thin statistical base, and bond yields, ETF flows, and Strategy (MSTR) balance-sheet moves will still drive the next leg.
Market impact
The setup reframes the current drawdown as a setup for a contrarian entry rather than a continuation signal, with the 50-week and 100-week lines converging near $89K as the technical anchor. Traders watching the cross will likely position around the print itself, treating the intersection as a catalyst rather than a confirmation. Whether the pattern holds a fourth time depends less on chart geometry and more on macro liquidity, ETF demand, and corporate treasury behavior into year-end.

Frequently asked questions
-
What is the Bitcoin 50-week vs 100-week bear cross?
It is a technical signal where the shorter 50-week simple moving average drops below the longer 100-week average, traditionally read as bearish. In Bitcoin's history the signal has instead marked cycle lows.
-
How soon could the bear cross happen?
At current trajectories the 50-week SMA at $89,771 could slip below the 100-week SMA at $88,397 within roughly a week, with BTC trading near $62,400.
-
Why would a bearish signal be bullish for BTC?
The cross reflects price action that already happened, the roughly 50% drop from $126,000 in October. By the time it prints, short-term speculators are typically flushed out and capitulation has cleared, which has historically been a bottom setup.
-
How reliable is this contrarian pattern?
Three prior bear crosses in BTC's history have each preceded a roughly three-year rally. The sample is small, and bond yields, ETF flows, and Strategy (MSTR) buying remain the dominant macro drivers.
-
What could invalidate the bottom call?
A deeper macro shock, sustained ETF outflows, or a shift in the broader economy could override the historical pattern and turn the cross into a continuation signal rather than a reversal.