








 Lookonchain
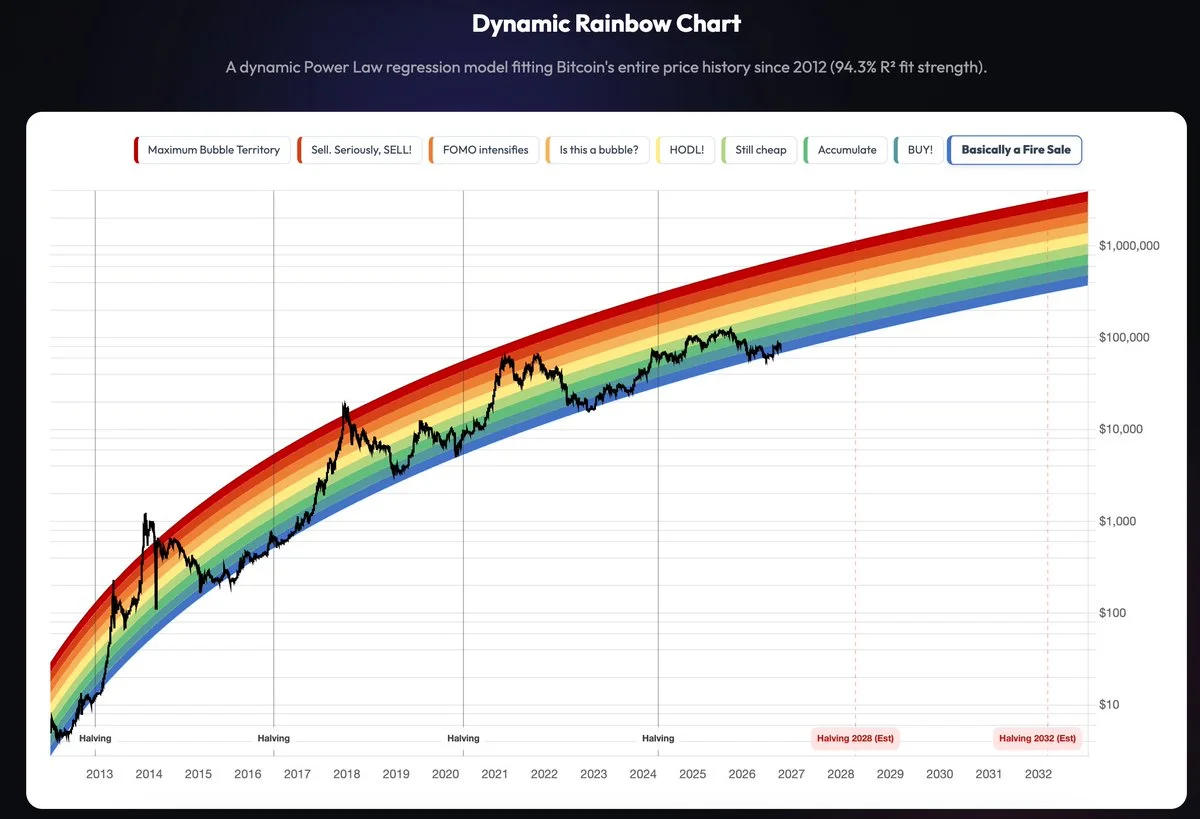
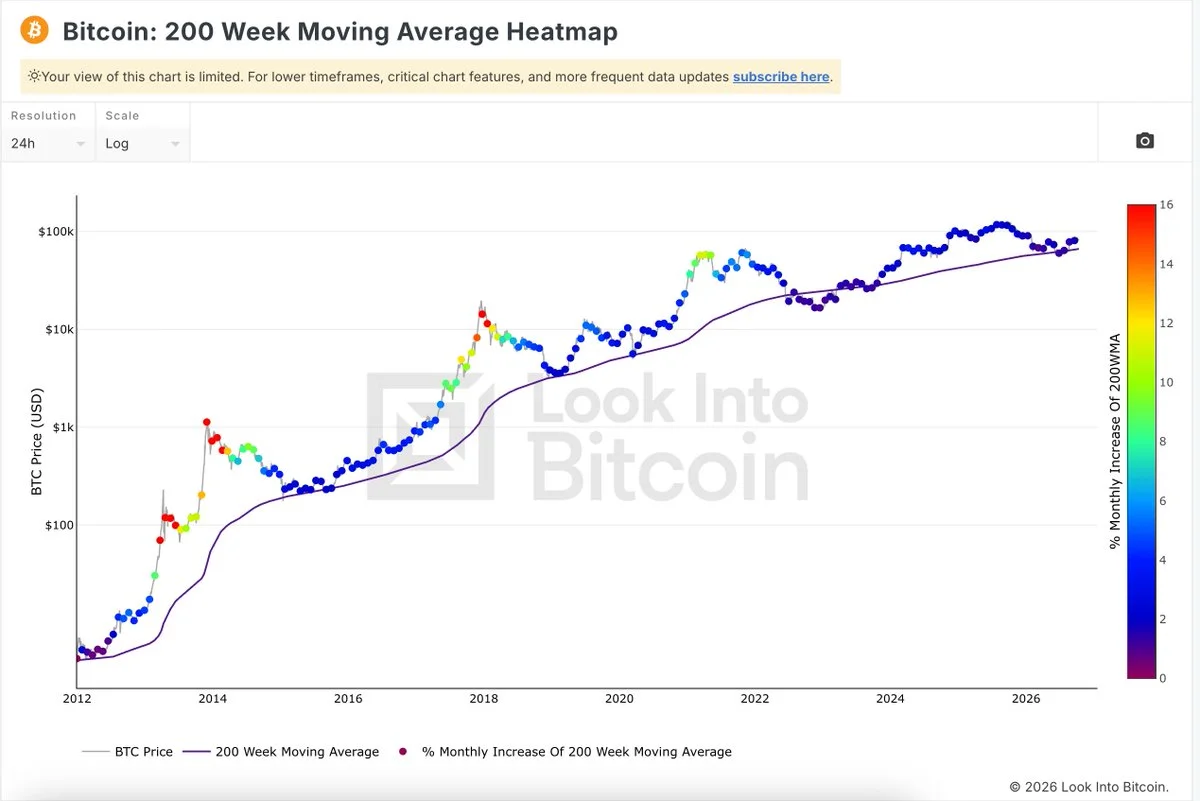
Both the Dynamic Rainbow Chart and the 200 Week Moving Average Heatmap are flashing buy signals for Bitcoin at the same time, according to BlockchainCenter's live trackers. Bitcoin last printed around $83,417 on the site's reference feed.
Why it matters
The Rainbow Chart plots Bitcoin's price against a logarithmic regression band, and a buy signal means price is sitting in the lower accumulation bands rather than the euphoric upper ones. The 200 Week Moving Average Heatmap measures how far price trades from the 200-week average, a level that has coincided with major cycle bottoms in previous bear markets. Both frameworks firing at once means two independent long-cycle models are describing the same zone, one grounded in regression bands and one in realized long-term cost basis.
Market impact
A dual buy signal is a positioning cue, not a prediction: these models are descriptive of where price sits relative to history, and they can stay in the buy zone for extended stretches. Traders will watch whether Bitcoin holds above the 200-week band on weekly closes, which would be the first confirmation the signal carries follow-through rather than marking another leg lower.
Source: [Bitcoin Rainbow Chart - Live | BlockchainCenter — BlockchainCenter.net](https://www.blockchaincenter.net/bitcoin-rainbow-chart/)

Frequently asked questions
-
What is the Bitcoin Dynamic Rainbow Chart?
It is a logarithmic regression chart that divides Bitcoin's price history into colored bands, from deep discount zones at the bottom to euphoric sell zones at the top. A buy signal means price is trading in the lower accumulation bands.
-
What does the 200 Week Moving Average Heatmap show?
It tracks how far Bitcoin's price sits from its 200-week moving average, a long-term cost basis proxy. Historically, price trading near that average has coincided with major bear-market bottoms.
-
What price is Bitcoin at on the BlockchainCenter tracker?
The live reference feed on BlockchainCenter showed Bitcoin at around $83,417 when the dual buy signal was flagged.
-
Do buy signals on these charts guarantee a price rally?
No. Both models are descriptive of where price sits relative to historical valuation bands, not predictive. Bitcoin can remain in the buy zone for extended periods before any reversal.
-
Why does it matter that both signals fired at once?
The Rainbow Chart is based on log-regression bands while the 200W MA Heatmap is based on long-term average cost, so they measure different things. Both describing the same zone means two independent long-cycle frameworks agree on the current positioning.
 Crypto News
 Crypto Rank News
 Benjamin Cowen
 CryptoSlate
 CoinDesk
 WuBlockchain
 CoinTelegraph
 Whale Alert