 CoinDesk
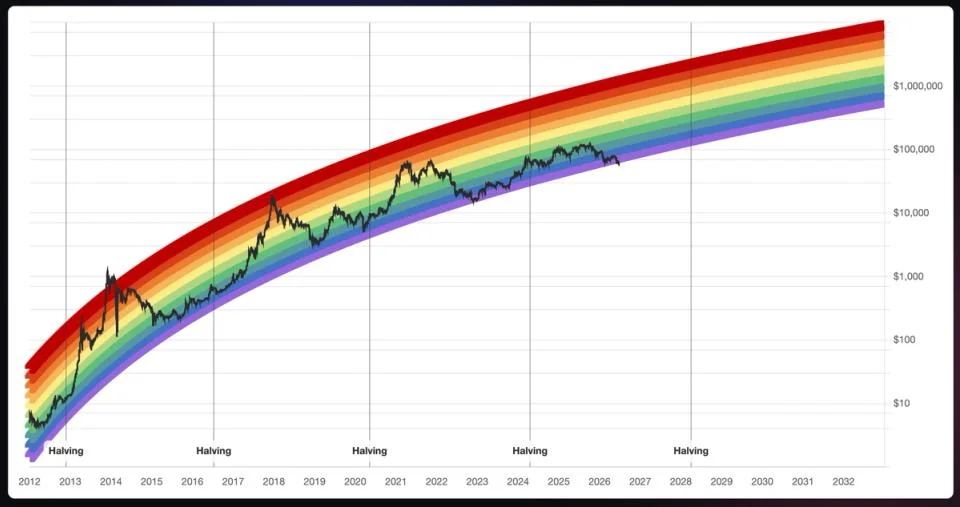


Bitcoin has fallen below the lowest band of the Bitcoin Rainbow Chart for the second time in the model's history, sliding into the original framework's purple "Bitcoin Is Dead" zone near $62,500. The move comes roughly 50% below the October 2025 all-time high of $126,000, and the first time the chart's floor has been breached with bitcoin trading at this scale of institutional liquidity.
Why it matters
The Rainbow Chart, built in 2014 by Reddit user Azop, uses a logarithmic regression to fit BTC's long-term price trend and sort it into coloured sentiment bands. A breach below the floor is rare: the previous trigger came in 2022 around $15,000, just before that cycle bottomed. Analysts are now split between two reads: that bitcoin is deeply undervalued, or that the chart itself is no longer a fit for a $1.25T asset shaped by ETF flows and macro liquidity rather than four-year retail boom-and-bust cycles.
Market impact
Markus Levin, co-founder of XYO, called the breach a "structural shift in the model" rather than a verdict on bitcoin, arguing the bands were calibrated to an illiquid, retail-driven asset and now describe a market that no longer behaves that way. Bitget chief analyst Ryan Lee was more measured, calling the chart a useful reference but not a predictive tool, and warned a dip into the low-$50,000s cannot be ruled out if risk sentiment deteriorates further. Ethra COO Emad Shahin framed it as "a fitted regression with a sense of humor, not a forecasting tool," while GoMining CEO Mark Zalan stressed that the "Bitcoin Is Dead" zone has historically marked extreme fear rather than permanent collapse. The breach also tracks with other valuation models losing their footing: the Stock-to-Flow projection overshot the post-2024 halving cycle, and BTC is now trading near its April 2024 halving price, a level that runs counter to the four-year cycle thesis the chart is built on.

Frequently asked questions
-
What is the Bitcoin Rainbow Chart?
It is a logarithmic regression model built by Reddit user Azop in 2014 that sorts BTC's long-term price trend into coloured sentiment bands, from a red "maximum bubble" top to a purple "Bitcoin Is Dead" floor.
-
How many times has bitcoin fallen below the Rainbow Chart's floor?
Only twice. The first breach came in 2022 near $15,000, just before that cycle bottomed. The current breach pushed BTC into the "Bitcoin Is Dead" zone around $62,500.
-
What does the 'Bitcoin Is Dead' zone actually mean?
It is a sentiment label, not a prediction. Historically the band has marked periods of extreme fear and undervaluation, often followed by recoveries, according to analysts including GoMining CEO Mark Zalan.
-
Why are analysts questioning the chart now?
The chart was calibrated to a retail-driven, illiquid asset and its exponential growth assumptions no longer fit a $1.25T market shaped by ETF flows, institutional balance sheets and macro liquidity, XYO co-founder Markus Levin told CoinDesk.
-
Could bitcoin fall further from here?
Bitget chief analyst Ryan Lee said a move into the low-$50,000s cannot be ruled out if risk sentiment deteriorates, though he added the chart itself offers limited insight into where a definitive market bottom may form.