 Lookonchain
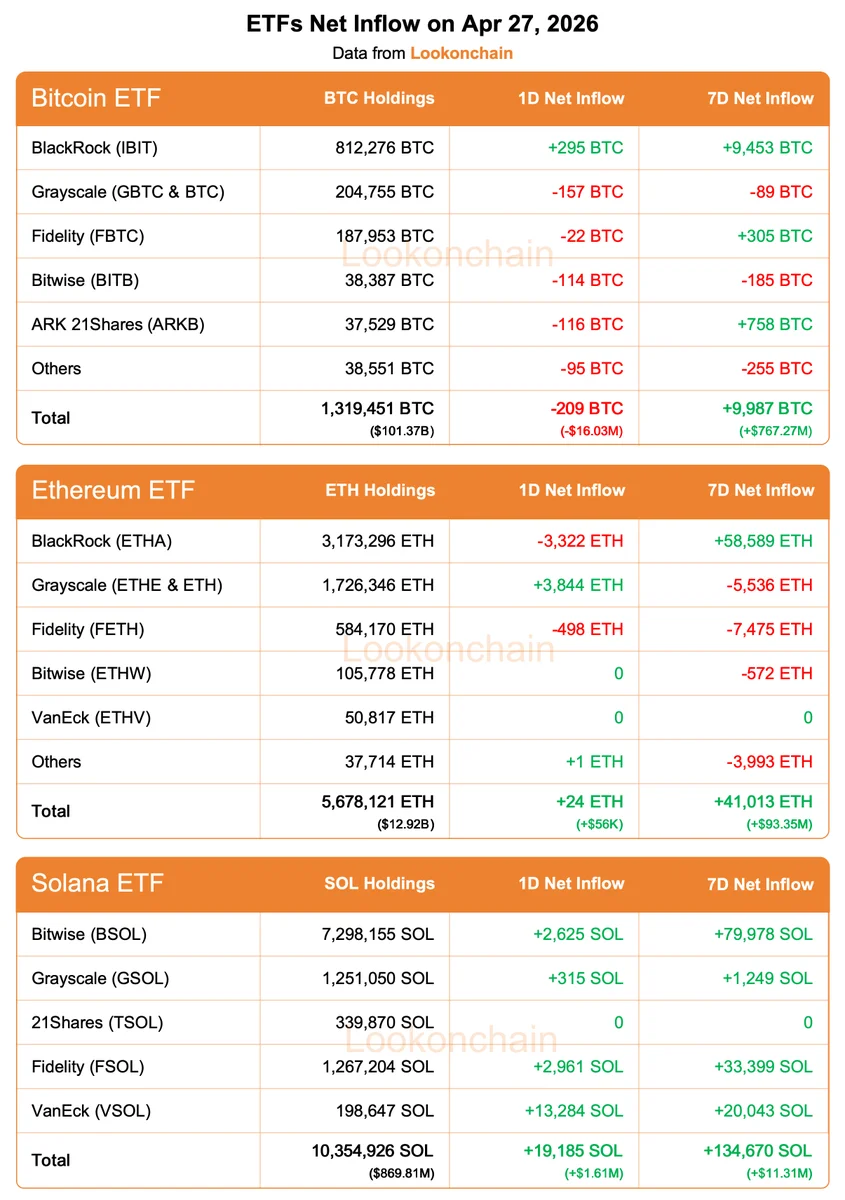
Spot Bitcoin ETFs saw a $16.03 million net outflow on April 27, shedding 209 BTC in a single session. The one-day red print, however, sits inside a strongly green weekly tape: 9,987 BTC (+$767.27M) in net inflows over the trailing seven days, pointing to persistent institutional demand despite day-to-day noise.
Why it matters
A single-day outflow in spot BTC ETFs is noise unless it marks a trend reversal. The seven-day cumulative figure is the cleaner read: $767M of net inflows over a week signals that institutional allocators are still adding exposure, treating dips as entries rather than catalysts for de-risking. The 1D red is positioning, not a regime change.
Market impact
Ethereum and Solana spot ETFs carried the week's momentum. ETH products pulled in 41,013 ETH (+$93.35M) over seven days, while Solana ETFs led on percentage terms, adding 134,670 SOL (+$11.31M). The 1D net flows were positive for both: +24 ETH and +19,185 SOL. The divergence is notable: Bitcoin absorbed a tactical outflow while ETH and SOL products continued to absorb capital, suggesting allocators are rotating within the crypto ETF complex rather than exiting it.


Frequently asked questions
-
Did spot Bitcoin ETFs actually lose money on April 27?
Yes — spot BTC ETFs saw a net outflow of 209 BTC, worth roughly $16.03 million, in the single April 27 session.
-
What was the seven-day trend for spot Bitcoin ETFs?
Over the trailing seven days, spot BTC ETFs booked net inflows of 9,987 BTC, worth approximately $767.27 million, despite the one-day red print.
-
How did Ethereum and Solana spot ETFs perform that week?
Ethereum spot ETFs added 41,013 ETH (+$93.35M) over seven days, while Solana spot ETFs led on momentum with 134,670 SOL (+$11.31M) in net inflows.
-
Why does a one-day outflow matter less than the weekly figure?
Day-to-day ETF flows are noisy; the cumulative weekly figure better reflects institutional intent. A $767M weekly inflow inside a single $16M outflow day signals structural demand, not a trend reversal.
-
Are allocators exiting crypto ETFs or rotating within them?
The data suggests rotation, not exit. With ETH and SOL products continuing to absorb capital while BTC took a breather, the cumulative $872M weekly inflow across the three complexes indicates allocators are reallocating within crypto rather than leaving the asset class.