 CoinDesk
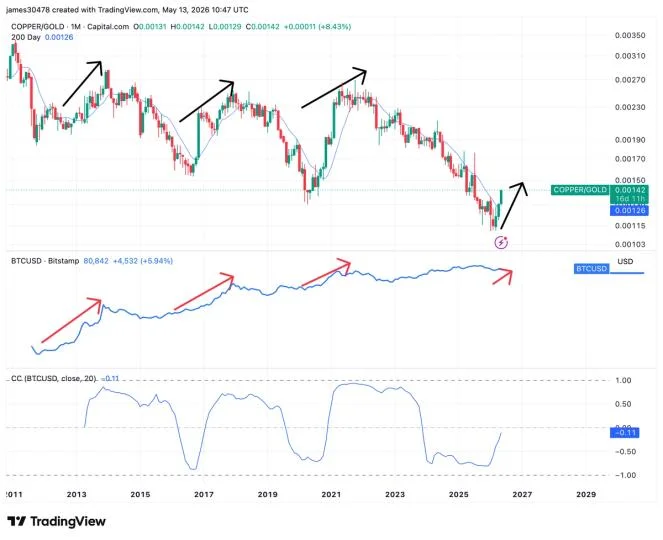


The copper-to-gold ratio has climbed above its 200-day moving average for the first meaningful time since September 2020, a move that has historically coincided with the early stages of bitcoin's strongest bull runs. The ratio currently sits at 0.00142, with copper trading around $6.65 a pound and gold near $4,700 an ounce — a 25% recovery off the lows that puts the cross-asset risk gauge back in breakout territory.
The correlation coefficient between bitcoin and the ratio is still slightly negative at -0.11, but it has rebounded sharply from near -1.00. The negative reading largely reflects the earlier divergence phase when the ratio was falling and bitcoin declined faster than copper; as the ratio recovers, the relationship has historically converged toward positive territory alongside improving macro conditions. During bitcoin's strongest bull runs, that correlation has moved toward or above 1.0.
Why it matters
The copper-to-gold ratio is widely treated as a barometer of economic momentum and investor risk appetite — copper tracks industrial demand and tends to outperform during expansion, while gold reflects defensive positioning. A rising ratio therefore signals a more risk-on macro environment. Previous surges in the cross in 2013, 2017 and 2021 aligned with major gains in bitcoin, and the ratio has historically led the largest cryptocurrency by several weeks to months. The 2020 analogue matters because the September 2020 breakout preceded the 2021 vertical phase; the current setup is the first time since then that the ratio has cleared its 200-day moving average with comparable force.
Market impact
The implication is that the current crypto rally may still be in its early stages rather than late cycle. With the correlation rebounding off an extreme negative and the ratio itself breaking trend, the macro tailwind for risk assets — bitcoin included — is only beginning to align with prior pre-rally setups. Watch for the correlation to flip positive and the ratio to extend above its breakout line; both are the conditions that historically accompanied bitcoin's strongest advances.

Frequently asked questions
-
What is the copper-to-gold ratio and why does it matter for bitcoin?
The copper-to-gold ratio compares the price of copper to gold and is used as a gauge of economic momentum and investor risk appetite. Copper tracks industrial demand, gold reflects defensive positioning, so a rising ratio signals a risk-on macro environment that has historically aligned with major bitcoin rallies.
-
When did the copper-to-gold ratio last break above its 200-day moving average?
The ratio has now climbed above its 200-day moving average for the first meaningful time since September 2020. That prior 2020 breakout preceded bitcoin's 2021 vertical phase, which is why analysts are watching the current setup closely.
-
What is the current correlation between bitcoin and the copper-to-gold ratio?
The correlation coefficient currently sits at -0.11, still slightly negative but rebounding sharply from near -1.00. During bitcoin's strongest bull runs the correlation has historically moved toward or above 1.0.
-
By how much has the copper-to-gold ratio recovered from its lows?
The ratio has risen about 25% from its lows, with copper trading near $6.65 per pound and gold near $4,700 per ounce, putting the cross at roughly 0.00142.
-
Could the current crypto rally still be in its early stages based on this signal?
Historically the copper-to-gold ratio has led bitcoin by several weeks to months, and previous surges in 2013, 2017 and 2021 aligned with major BTC gains. With the ratio just clearing its 200DMA and correlation rebounding off an extreme, the macro tailwind for bitcoin may still be building.