








 Crypto News
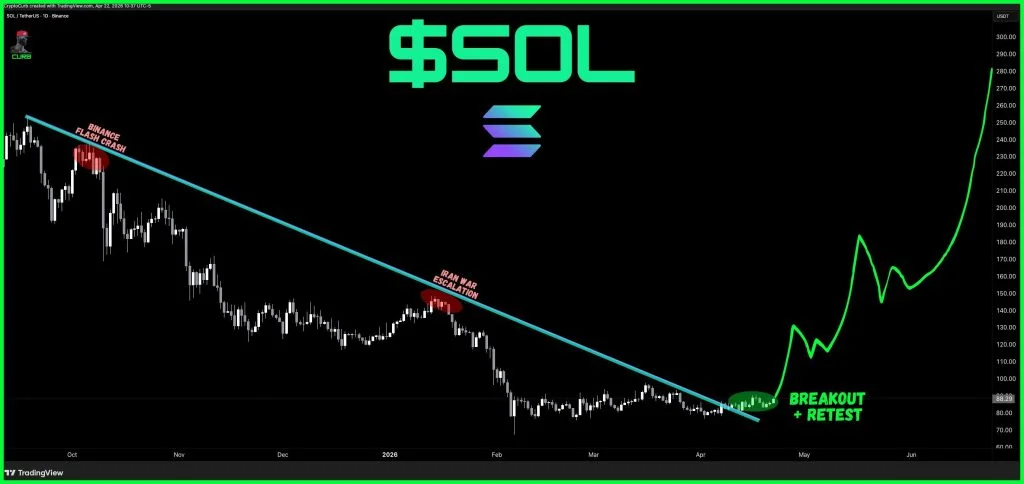

Solana's price broke above a months-long descending trendline on the daily chart this week, with SOL trading near $85.50 even as a 0.4% 24-hour dip kept bulls on the defensive into the weekend. Analyst CryptoCurb flagged the breakout on X, noting the same falling trendline had capped price through multiple macro shocks — including a late-2025 Binance flash crash and the Iran war escalation. The setup now hinges on a retest hold: if buyers defend the broken trendline as new support, the signal stays live; if it fails, the breakout degrades fast.
Why it matters
The descending trendline had acted as a ceiling for SOL across several macro events, which is what makes the break technically meaningful rather than cosmetic. On the weekly timeframe, analyst Rendoshi AI is watching for confirmation of the short-term downtrend from SOL's late-2025 peak breaking as well — a move that would clear a path toward the $120 zone. That level sits just under the 200-day simple moving average, currently towering in the $116–$124 band, which is the next real technical obstacle above the breakout point.
Market impact
The short-term tape is directionless: SOL is chopping just under its 50-day average, with $85 the line that bulls need to defend to keep structure intact and $88.7 the trigger for a push into the low $90s. A break below $84 would weaken the setup and bring $82 back into play, delaying any recovery. Weekend liquidity is typically thin, so the next 48 hours carry outsized weight for the medium-term trend — and a successful retest and weekly confirmation would put the $120 target back on the table with the 200-day SMA acting as the final gate.

Frequently asked questions
-
What trendline did Solana just break on the daily chart?
SOL broke above a months-long descending trendline that had capped price through multiple macro shocks, including a late-2025 Binance flash crash and the Iran war escalation. Analyst CryptoCurb flagged the breakout on X.
-
What is the next major price target for SOL if the breakout holds?
The next major target is the $120 zone, which sits just under the 200-day simple moving average in the $116–$124 band. Analyst Rendoshi AI is watching for the short-term downtrend from SOL's late-2025 peak to break on the weekly chart to confirm the path.
-
What level does Solana need to hold to keep the bullish setup intact?
Bulls need to defend the $85 area and the broken trendline as new support. A break below $84 would weaken the structure and bring $82 back into play, delaying any recovery.
-
What price level would trigger short-term momentum for SOL?
A push and hold above $88.7 is the trigger for momentum to build, opening a move into the low $90s and shifting the short-term narrative from consolidation to recovery.
-
Why are the next 48 hours significant for SOL's medium-term trend?
Weekend liquidity is typically thin, which amplifies the importance of the immediate retest of the broken trendline. A successful retest plus weekly chart confirmation would put the $120 target back on the table, with the 200-day SMA acting as the final technical gate.
 CoinDesk
 WatcherGuru
 TheBlock
 WuBlockchain
 CryptoSlate