








 CoinDesk
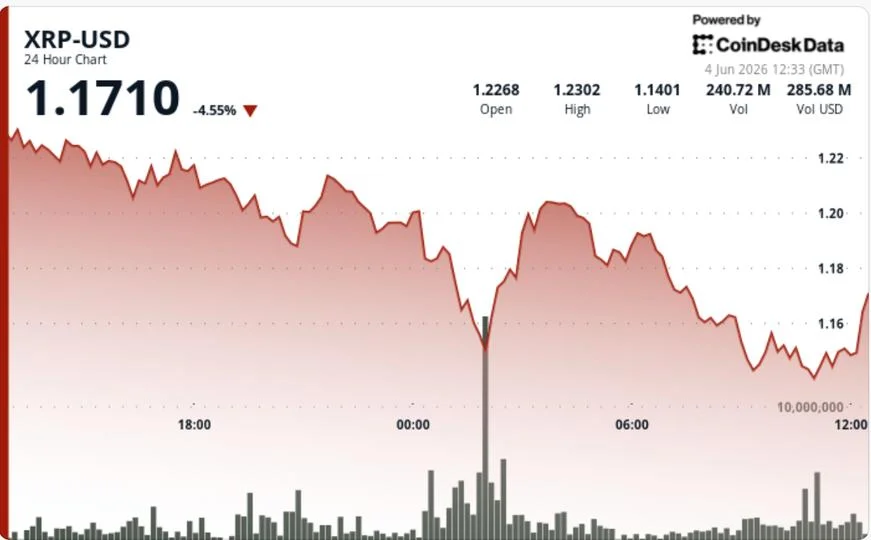

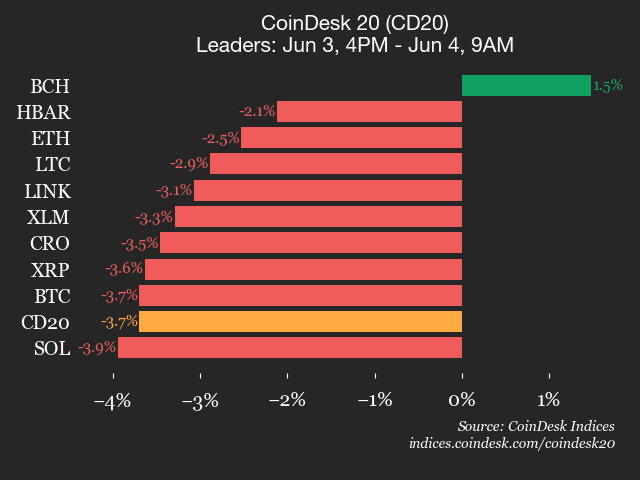

Ripple-linked XRP fell 7% over the past 24 hours to roughly $1.15, erasing the $1.20-$1.60 trading range that had defined the past four months and touching levels last seen during February's selloff. The token dropped from $1.2360 to $1.1497 during the session, with volume surging to 248.2 million XRP during a key support test — one of the largest trading bursts of the week. The decline marks the 14th anniversary of the network's 2012 genesis in distinctly bearish fashion, with monthly RSI slipping below 43, a level reached only a handful of times in the asset's history.
Why it matters
The split between flow and price is the story. XRP investment products recorded $20.3 million in weekly inflows even as digital asset funds broadly suffered $1.5 billion in outflows, and more than 25 million XRP left exchanges in recent days — a pattern that typically signals longer-term accumulation rather than imminent selling. Yet price action has refused to confirm any of it. When a market stops responding to bullish structural developments, traders tend to discount the narrative and read the chart instead, which is exactly the regime XRP has slipped into.
Market impact
The bigger issue isn't the magnitude of the decline but the repeated failure of recovery attempts. January's rally stalled near $2.40 and a May rebound attempt failed around $1.54, reinforcing the broader downtrend even as institutional products kept absorbing supply. The $1.14-$1.15 area has emerged as the immediate support zone, with a break below shifting focus to $1.11 and potentially the sub-$1.00 area. $1.28, which acted as support through most of the spring consolidation, has flipped to resistance. A sharp bounce from the $1.14 area produced signs of short-term seller exhaustion, but volume outside the initial reversal stayed routine, limiting confidence in a durable recovery. XRP is now at a genuine inflection point — either buyers defend the current range with conviction, or four months of consolidation turns into a much larger breakdown.

Frequently asked questions
-
Why is XRP falling if ETF inflows are positive?
XRP investment products recorded $20.3M in weekly inflows and 25M+ XRP left exchanges, yet price erased its four-month range to ~$1.15. The disconnect means the market is no longer rewarding structural accumulation — chart levels and failed recovery attempts near $2.40 and $1.54 are driving the move instead.
-
What are the key support and resistance levels for XRP now?
Immediate support sits in the $1.14-$1.15 zone. A break below opens $1.11 and potentially sub-$1.00. $1.28 has flipped from spring support into the first major resistance XRP would need to reclaim to stabilize sentiment.
-
What does XRP's monthly RSI below 43 signal?
Monthly RSI has slipped below 43, a level reached only a handful of times in XRP's history. Previous occurrences coincided with major market resets, though not necessarily immediate bottoms — it flags extreme bearish momentum rather than a precise reversal point.
-
How much volume traded during the XRP selloff?
Volume surged to 248.2 million XRP during the $1.14 support test, marking one of the largest single-session bursts of the week. Volume outside the initial reversal candle remained routine, limiting confidence in the short-term bounce.
-
Is XRP at an inflection point or in a broader downtrend?
Both. The token is at a genuine inflection: buyers either defend the $1.14-$1.15 range with conviction, or four months of consolidation breaks down into a much larger move. January's stall near $2.40 and May's failed rebound at $1.54 reinforce the broader downtrend until proven otherwise.
 CoinTelegraph
 CryptoSlate
 Crypto News
 WatcherGuru
 Lookonchain
 Crypto Rank News
 WuBlockchain
 Altcoin Daily