What is Cumulative Volume Delta, and why traders bother with it
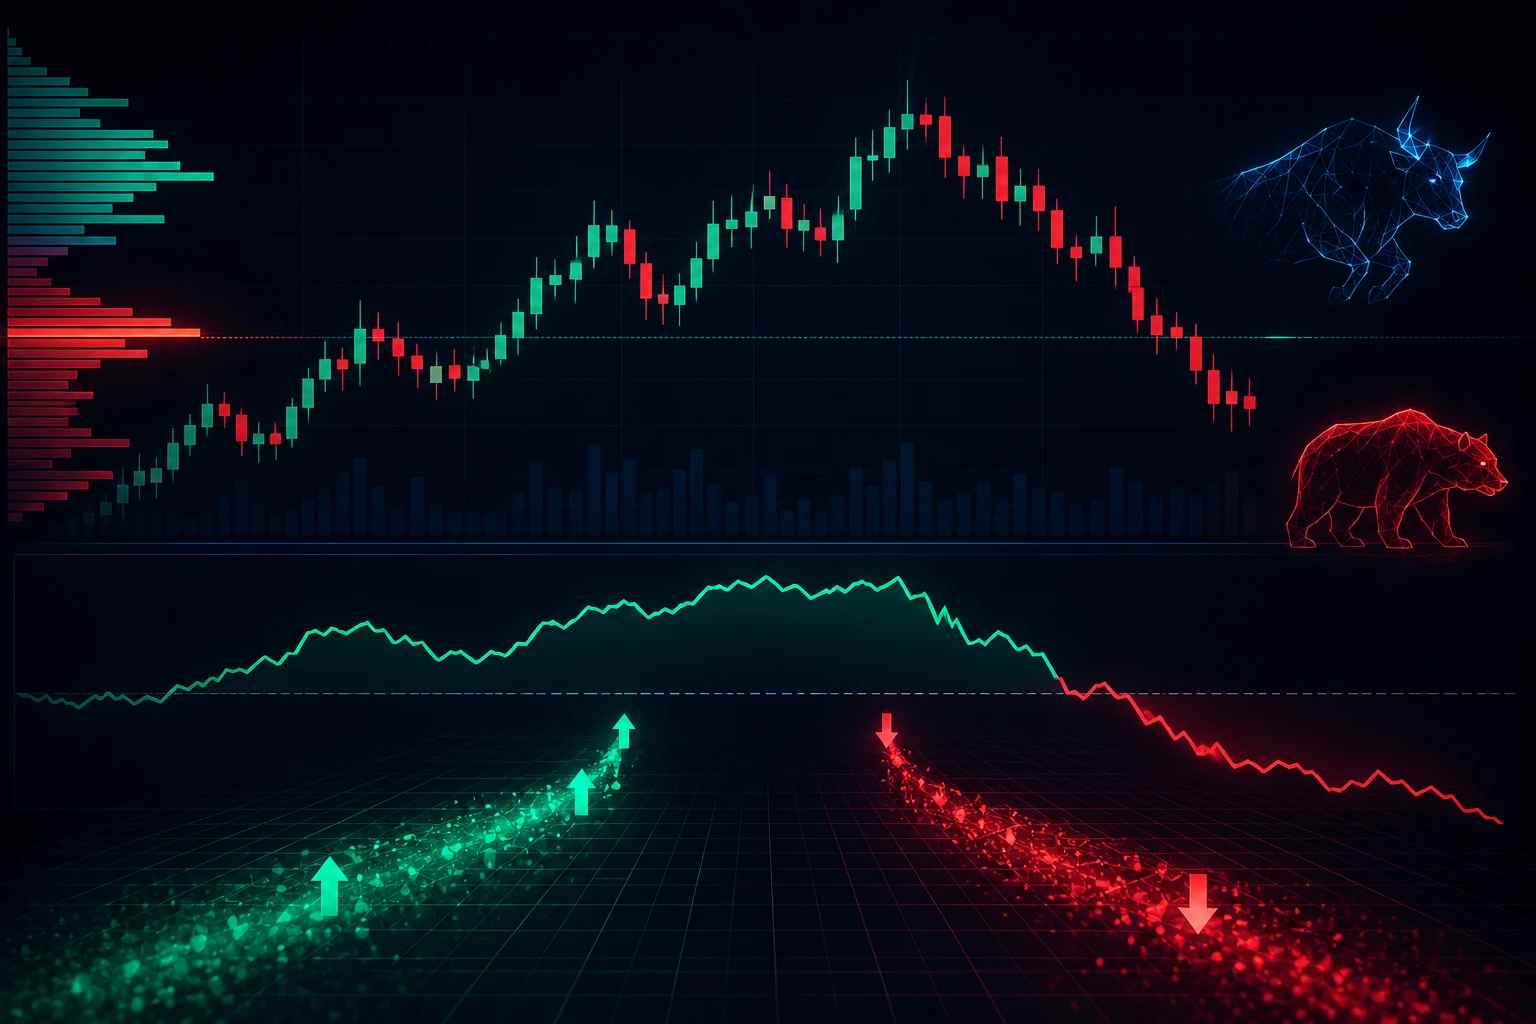
Every market transaction has two sides. Someone hits the bid, and someone lifts the offer, and the trade prints on the tape. Plain candle volume counts both sides as one number, which is fine for showing activity, but it hides a useful question: on this last hour, did buyers initiate more contracts than sellers, or the reverse? Cumulative Volume Delta answers that by subtracting sell volume from buy volume on each candle, then summing the result over a running window. A positive bar means net buying aggression on that bar, a negative bar means net selling aggression, and the running line drifts upward when buyers are in control and downward when sellers are in control.
The reason traders care is that price and aggression can disagree. A green candle with falling CVD suggests price rose but sellers were quietly lifting offers, which is a softer tape than the candle implies. A red candle with rising CVD shows that even though price fell, buyers were absorbing sell orders faster than they could push lower. These are the moments where CVD earns its keep, because regular volume tells you nothing about who is leaning into the move.
In crypto, CVD lives naturally alongside BTC and ETH perpetual futures, where every contract has a clear aggressor side and order book data is captured bar by bar. Spot markets can also feed CVD on exchanges that publish tape, though the granularity varies by venue.
The risks and limits of using CVD
No trader tool is free of failure modes, and CVD has several that beginners tend to underestimate. The first is feed quality. CVD is computed from raw trade prints, and a venue that reports trades slowly, batches them, or routes some volume off-feed will produce a CVD line that drifts away from reality. Aggregated feeds from Coinalyze and Velo smooth this by averaging across several exchanges, but aggregation cannot invent data that was never reported, so a thin altcoin pair with two market makers will give a CVD that mostly reflects the routing choices of those two firms.
The second limit is spoofing and iceberg-style behavior. A market maker who wants to push price into a liquidity pocket can stack the book with orders they intend to cancel, lifting CVD briefly on the side they want and then removing the orders. Real volume eventually unwinds this, but intraday CVD spikes can mislead a manual reader.
The third limit is timeframe creep. A 5-minute CVD divergence means something quite different from a daily CVD divergence on BTC versus an ERC-20 micro-cap. Most false signals come from applying a divergence read on a chart the data cannot support, so the rule of thumb is that CVD is most useful on the highest-liquidity pairs at intraday to swing horizons, and least useful on thin altcoin books at low timeframes.
Finally, CVD is not a standalone trigger. It does not know about liquidity sweeps, liquidation cascades, or news-driven gaps, and it cannot tell you whether an aggressive buyer is a whale hedging, a bot rotating inventory, or a market maker absorbing flow. Treat CVD as one filtered lens, not as a verdict.
How CVD is actually calculated on a chart
Conceptually, the math is straightforward. For each candle, the platform splits trades into two buckets, buys and sells, based on whether the trade was executed at the ask price or the bid price. A trade hitting the ask is a buy aggressor. A trade hitting the bid is a sell aggressor. The difference, buy volume minus sell volume, is the bar's delta. Adding each bar's delta to a running sum gives the cumulative line.
Mechanically, this means three choices drive every CVD chart you see. The first is the classification rule: did a trade that prints exactly at the midpoint count as a buy or a sell? Different platforms have different conventions, and switching platforms can change your chart retroactively. The second is the aggregation window: are you looking at deltas from one exchange, several exchanges, or the entire futures complex? Aggregated prints are usually closer to truth but slower to load and harder to reproduce. The third is the reset behavior: some platforms let you reset CVD at the start of each session, each day, or each swing high, which changes how the line behaves.
On TradingView, CVD is most commonly plotted as the built-in indicator that pulls aggregated tick data through partner feeds, or through community scripts that compute it from exchange webhooks. The accuracy depends on the data license behind the script, so free indicators on low-volume pairs are the least reliable. On Coinalyze and Velo, CVD is a first-class chart object on perpetuals from BTC and ETH down to mid-cap tokens, and the platform handles aggregation across multiple venues, which is the main reason traders prefer these sources for serious work.
A practical step when you start any new pair is to look at the raw trade print stream alongside the CVD line on a single five-minute candle. If the buy and sell buckets on the bar look balanced but the CVD line jumps dramatically, the classification rule is doing something you do not understand, and you should not trade that signal until you do.
How to read divergences between price and CVD
Divergence is the part of CVD that draws beginners, and it is also the part most often misread. A bullish divergence is when price prints a lower low but CVD prints a higher low, suggesting that on the second leg down, the market absorbed the selling more cheaply than it did on the first leg. Bears are still in control of price, but their aggression is fading. A bearish divergence is the mirror image: price prints a higher high but CVD prints a lower high, meaning the second push up is being met with relatively less buying, even though price keeps grinding.
These signals are not magic. They work because they capture a specific kind of exhaustion, in which one side is willing to push price but the other side is no longer willing to follow. When that imbalance reverses, the move extends or reverses quickly, because the side that was hiding has to cover. The signal fails when the divergence is on too short a window, when volume is too thin to read aggression reliably, or when a major external event (a Federal Reserve decision, an exchange hack, a token unlock) overwhelms the tape. On a 5-minute chart of a low-cap altcoin, any individual divergence is closer to noise than signal. On a 4-hour chart of BTC perpetuals with hundreds of millions in volume per bar, the same pattern has been a useful timing tool for years.
A common mistake is to trade the divergence as a hard reversal trigger. Treat it as a context flag instead. If price is grinding up on high CVD, the trend is healthy. If price makes a new high on fading CVD and your broader read also shows weakening sentiment, that is when a pullback becomes more likely. If your other reads disagree, the divergence is probably noise.
Where to actually find CVD charts that work
The honest answer is that source matters as much as the indicator itself. TradingView exposes CVD through community scripts and through its premium data feeds, with quality depending on the underlying license. For BTC and ETH perpetuals, TradingView's premium data is adequate for swing analysis. For lower-cap tokens, the picture gets murkier, and most experienced traders cross-check at least one other source before acting.
Coinalyze specializes in aggregated futures data and treats CVD as a first-class chart on most perpetual pairs. It pulls from multiple venues and reconciles them, which is why its CVD line tends to disagree with single-exchange prints at turning points. The trade-off is that aggregated data lags spot reads by a few seconds, which matters for sub-five-minute scalps and not at all for swing traders.
Velo Data (formerly known as Coinalyze-adjacent tools and now under the Velo brand) provides a similar aggregated feed with strong API access, so traders who build their own dashboards tend to lean on Velo for raw streams. Both platforms support historical playback, which is the only way to develop a feel for how CVD behaves across different market regimes.
A reasonable setup for an intermediate trader is to run TradingView as the charting canvas, Coinalyze or Velo as the data authority on CVD, and an exchange-native tape as the sanity check. If all three agree on the sign and direction of CVD on a given bar, you are reading the most reliable signal that the public retail stack can produce. If they disagree, you are reading noise.
CVD alongside the broader signal stack
CVD on its own is a momentum filter, not a thesis. Where it earns more weight is in a small stack. Open interest tells you whether new contracts are entering the market. Funding rates tell you how crowded the directional bet has become. Liquidations show when leverage has been forcibly unwound. A long side that is grinding up on rising CVD with stable funding and rising open interest is a high-conviction trend. A long side that is grinding up on rising CVD with funding flipping positive and shorts getting liquidated is approaching exhaustion. A long side that is grinding up on flat CVD with open interest falling is the classic late-stage move that retail tends to chase late.
Sentiment data fits next to CVD rather than inside it. When headlines start to skew bullish, social chatter amplifies, and CVD continues to confirm, the bar for a pullback gets higher because the remaining shorts are exhausted. When sentiment is already extreme bullish and CVD begins to diverge down, that combination is the strongest reversal warning most public tools can give.
This is also where a tool like Zippfeed earns its place. CVD shows you aggression, Zippfeed shows you whether the broader narrative is supporting or fighting that aggression. Used together, they cut down on the mistake of reading a clean divergence at the exact moment that a forgotten news story is about to break.
How to follow CVD-driven moves the smart way
CVD is one of the most useful but also one of the most abused indicators in retail crypto trading, because it looks like a clean signal until you realize how much it depends on feed quality and timeframe. Treat the running line as a momentum gauge and divergences as context flags rather than reversal triggers, run your analysis on aggregated data from Coinalyze or Velo rather than a single-exchange stream, and refuse to read CVD on thin altcoin books at low timeframes where spoofing dominates. CVD moves fast and so does the news around it, so tracking the tape alone is a losing game. Zippfeed surfaces crypto headlines with sentiment scoring and an importance rating, so you can see when a CVD divergence is forming against a quiet backdrop and when it is forming right before a catalyst hits.


 WuBlockchain
 CryptoSlate
 Glassnode
 WatcherGuru
 Altcoin Daily