 CoinDesk
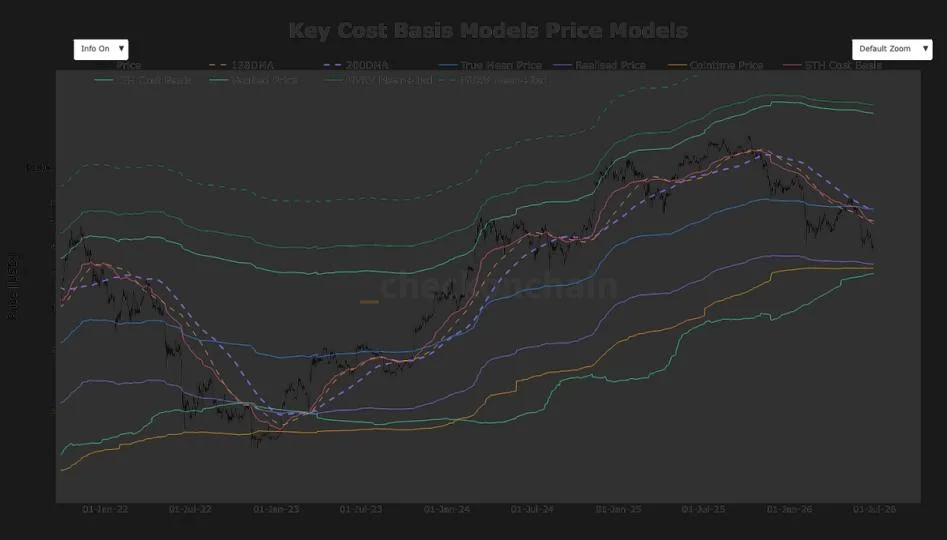


Bitcoin is trading below a wall of major technical and onchain valuation levels at once, with the True Mean Price near $76,300, the 200-Day Moving Average at $75,500, the 128-Day Moving Average at $70,900, and the Short Term Holder Cost Basis at $69,600 all sitting above spot. The convergence leaves price in what chartists call a no man's land, with no nearby onchain support until the long-term holder cost basis at $49,900.
The composition of those overhead levels matters as much as the count. The True Mean Price adjusts the network's average acquisition cost for lost or inactive supply, the 200-day MA is the long-running bull-bear trend divider, the 128-day tracks the intermediate cycle, and the short-term holder cost basis captures the entry price of every coin moved in the last ~155 days. When all four simultaneously trade above price, it signals that recent buyers are already underwater and long-term holders are sitting on unrealised gains rather than losses.
Why it matters
The next real support isn't nearby. Below spot sit the Long Term Holder Cost Basis at $49,900, the Coin Time Price at $51,700, and the Realized Price at $53,200, the average price at which all circulating bitcoin last moved onchain. These are the levels where the supply-weighted cost basis of the network itself begins to provide a floor, and they are 20-30% below the current price. The gap is why the technical picture reads as a no man's land: there is no dense band of onchain support between here and there.
Market impact
Historical bear market cycles offer a template. Bitcoin has previously bottomed roughly 5-10% below the major onchain valuation metrics, meaning a repeat of that pattern would imply a cycle low in the region of $45,000. The setup is consistent with a late-stage bear rather than a shallow correction, though the historical sample is small and each cycle's macro context differs. What changes the read is whether the overhead cost-basis levels flip from resistance to support on a relief rally, or whether price simply re-tests the lower onchain band first.
The asymmetry is the story.

Frequently asked questions
-
What does it mean that Bitcoin is in a technical no man's land?
It means price is trading below several major technical and onchain valuation levels at once, with the next dense band of onchain support 20-30% lower. There is no nearby cost-basis floor between current price and the long-term holder level at $49,900.
-
Which major cost-basis levels does Bitcoin currently sit beneath?
Bitcoin is trading below the True Mean Price near $76,300, the 200-Day Moving Average at $75,500, the 128-Day Moving Average at $70,900, and the Short Term Holder Cost Basis at $69,600.
-
Why does the historical pattern point to a $45,000 bottom?
Previous major bear market cycles have seen bitcoin bottom roughly 5-10% below the key onchain valuation metrics. A repeat of that undershoot against the current onchain band implies a cycle low in the region of $45,000.
-
What onchain support levels are closest below the current Bitcoin price?
The nearest onchain support levels are the Long Term Holder Cost Basis at $49,900, the Coin Time Price at $51,700, and the Realized Price at $53,200, the average price at which all circulating bitcoin last moved onchain.
-
Does a 5-10% undershoot below onchain metrics guarantee a $45,000 low?
No. The 5-10% undershoot is a historical pattern drawn from a small sample of prior cycles, each of which had a different macro context. It frames a plausible target range rather than a forecast, and the actual low depends on liquidity, macro conditions, and how the overhead cost-basis levels behave on any relief…