








 Crypto News
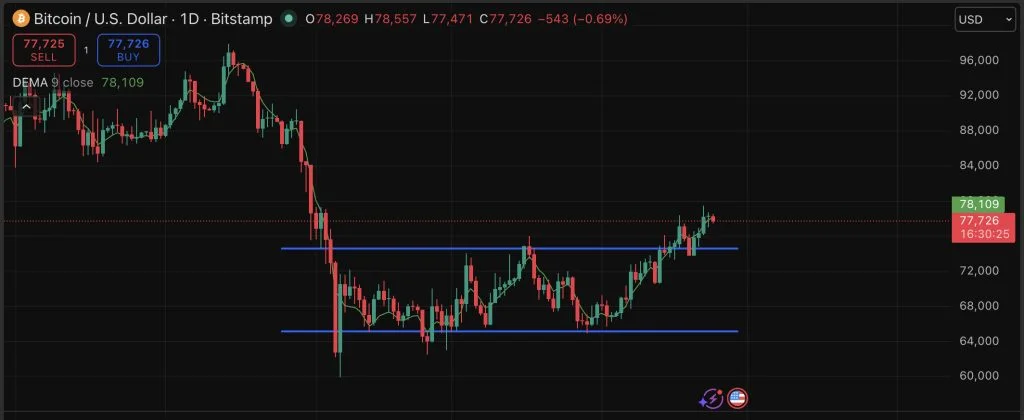

Bitcoin is trading near $78,000, capped just below the $79,000 resistance that has rejected price twice in the last ten days, while support clusters at $72,000-$73,000 with deeper Fibonacci support at $70,000-$68,000. One widely-shared bearish thread from trader @ethanfeyrer projects a 36% drop toward $50,000 if Bitcoin's range-bound structure resolves to the downside, and the piece maps three historical consolidation periods of 64 to 114 days that ended with two crashes of 27% and 33% respectively. A counter-thread from @piovincenzo_ pushes back on the $50K thesis, pointing to a prior drop from $125K to $60K that already flushed late longs, the Iran-conflict lead-in, and continued multi-billion-dollar weekly buying by Strategy.
Why it matters
The setup is unusually binary. Bitcoin has spent roughly two and a half months compressing between roughly $72K and $79K, and every prior consolidation of this length in this cycle has resolved with a violent move in one direction. A separate analyst cited in the piece pegs an even more brutal bear floor at $30,000-$40,000 if the $79K breakout fails — a level that would imply the entire post-ETF rally has unwound. The counterweight is institutional: spot Bitcoin ETF inflows have run positive for more than two consecutive weeks, and Strategy has been buying billions of dollars of BTC per week at these prices, both of which create a structural bid the 2022-range-down did not have.
Market impact
The risk-reward math is what the chart-watchers are focusing on: roughly 36% downside to $50,000 against less than 5% upside to $80,000 from spot. The model's read is that $72,000 is the pivot — hold it and the path opens to an $80,000-$90,000 run; lose it cleanly and the next bids are thin, with a cascade toward sub-$50,000 the realistic worst case. ETF flow data is the cleanest forward tell: a second consecutive week of large net inflows would confirm the structural bid and pressure the bearish thesis, while a single outflow-heavy session would tighten the range's downside odds materially.

Frequently asked questions
-
Why is Bitcoin stuck under $79,000 right now?
Bitcoin is trading near $78,000 with $79,000 acting as resistance that has rejected price twice in the last ten days. The level caps a roughly two-and-a-half-month compression between approximately $72K and $79K.
-
What is the $50,000 Bitcoin price prediction based on?
Trader @ethanfeyrer mapped three historical consolidation periods of 64 to 114 days that ended with two crashes of 27% and 33%, projecting a similar 36% drop from current levels to $50,000 if the range resolves to the downside.
-
Where is the key support level for Bitcoin in this setup?
Support clusters at $72,000-$73,000 with deeper Fibonacci support at $70,000-$68,000. The analysis flags $72,000 as the pivotal line to hold for a continuation toward $80,000-$90,000.
-
What would invalidate the bearish $50,000 scenario?
Sustained spot Bitcoin ETF inflows and continued multi-billion-dollar weekly buying by Strategy create a structural bid that the bearish case does not assume. More than two consecutive weeks of large net inflows back the bull thesis and pressure the $50K call.
-
What is the worst-case Bitcoin price target from the analysis?
A separate analyst cited in the piece pegs an even more brutal bear floor at $30,000-$40,000 following a failed $79K breakout — a level that would imply the entire post-ETF rally has unwound.
 Lookonchain
 Benjamin Cowen
 Crypto Capital Venture
 CoinDesk
 WatcherGuru