 CoinDesk


Bitcoin trades near $64,000 — but a Fibonacci pattern that has held since the asset's earliest days points to a 61.8% retracement of the entire move from near zero in early 2010 to the latest bull peak above $126,000, and that level sits around $48,215. If the pattern repeats, it would imply another 25% drop from current prices.
Why it matters
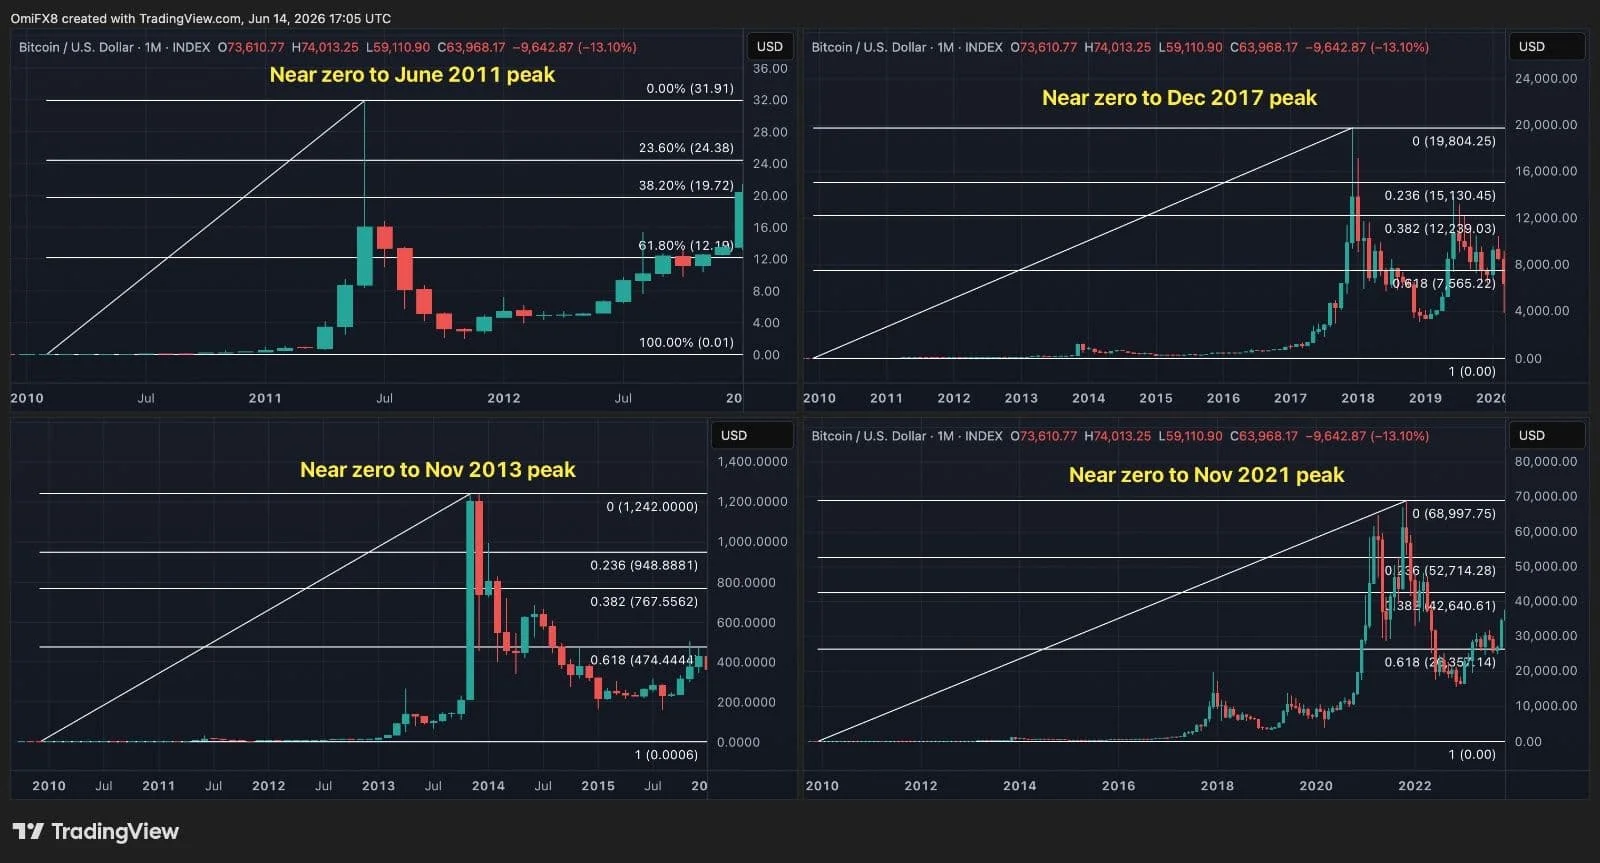
The pattern works like this: draw Fibonacci retracements from bitcoin's first traded price of $0.003 in February 2010 to every prior bull market peak — June 2011, November 2013, December 2017, and November 2021. The bear markets that followed each of those peaks broke below the 61.8% retracement of the entire move from near zero to peak. Four peaks, four bear markets, four breaks below 61.8%. No exceptions.
With the current cycle peaking above $126,000 earlier this year, the 61.8% level now sits at $48,215 — well below spot.
Market impact
The caveat is structural, not cosmetic. Four cycles is still a small sample, and the bitcoin market today is dominated by spot ETFs, institutional treasuries, and sophisticated derivative flows that didn't exist during previous retracements. That maturity may provide an early floor before the pattern fully plays out — but it has yet to be tested.
The chart implication is binary: either the 61.8% line holds for the first time in bitcoin's history, or a measured move toward $48,000 enters the realm of historical precedent rather than speculation.

Frequently asked questions
-
What is the chart implication if the pattern holds?
A measured move toward $48,215 — the 61.8% retracement from near zero to the current peak. The chart implication is binary: either 61.8% holds for the first time in bitcoin's history, or it breaks and a historically patterned downside enters the realm of precedent rather than speculation.