








 CoinDesk

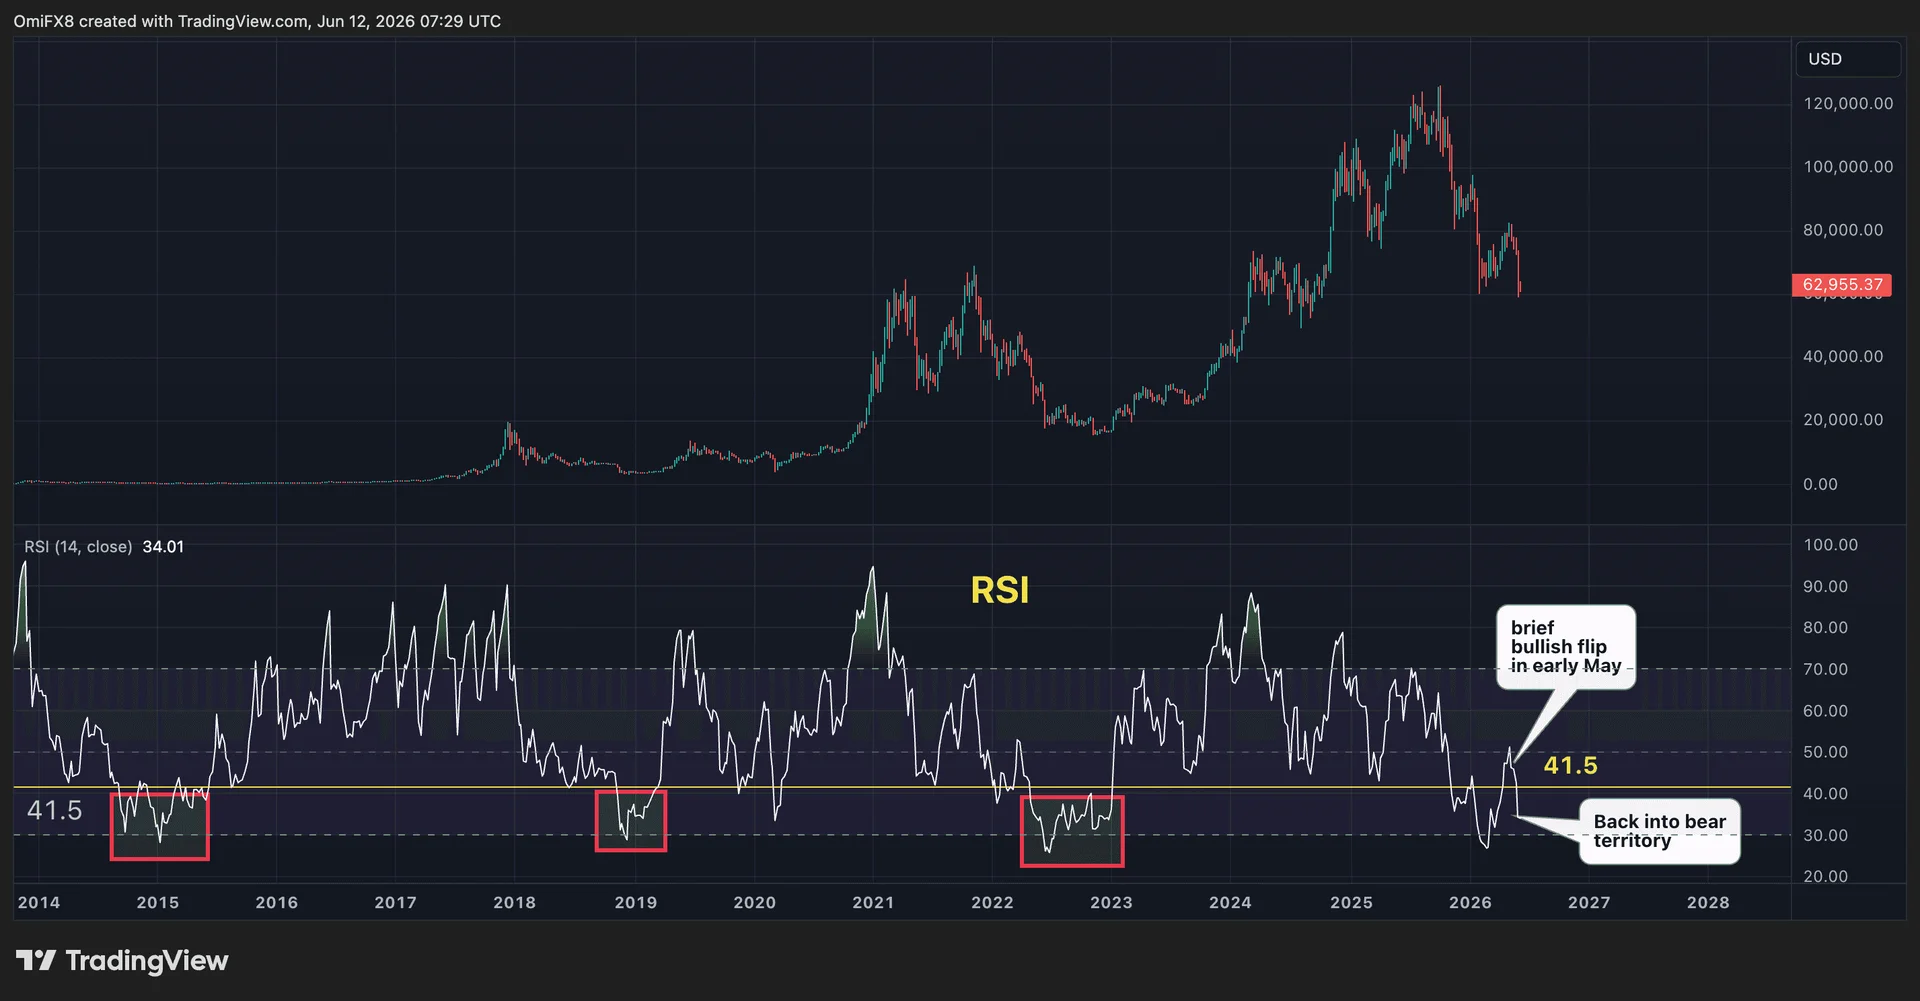


Bitcoin's weekly relative strength index remains below 41.5 — a level that Material Indicators says has reliably separated bullish and bearish macro regimes across the 2015-17, 2020-21, and January 2024-November 2025 cycles. The 14-week RSI was last reading 34.00 with BTC trading little changed over 24 hours near $63,000, leaving the gauge well under the dividing line that has marked the floor of every prior bear market's deepest phase.
Material Indicators co-founder Keith Alan framed the current setup in blunt terms: "Bitcoin is below it, and still trending down. That does not mean price has to collapse, but it does mean the burden of proof is still on the bulls." Without a sustained RSI recovery back above 41.5, recent price bounces read as relief rallies within a downtrend rather than the start of a new bull leg.
Why it matters
The 41.5 line is not a moving average or a single-cycle artifact — it's the level the 14-week RSI held above through the entirety of three prior bull markets and fell below during the most intense stretches of every major drawdown: late 2018, May-December 2022, and the recent slide. That cross-cycle consistency is what makes it a regime marker rather than just a momentum oscillator reading. While the indicator is below 41.5, the historical record argues against declaring a bottom on the basis of price action alone.
Market impact
Alan's next downside trigger is 31.89, the prior weekly RSI low — a break below that would mark a fresh leg lower in momentum and historically has coincided with the worst phases of prior bear markets. Until the indicator reclaims 41.5, traders using RSI-based frameworks are likely to treat rallies as selling opportunities rather than entries, which caps upside follow-through even on positive macro catalysts. The threshold to watch is binary: a clean weekly close back above 41.5 would be the first mechanical signal that the broader trend has turned.

Frequently asked questions
-
What is the key RSI level to watch for Bitcoin's bottom?
The 14-week RSI level to watch is 41.5, which Material Indicators says has separated bullish and bearish macro regimes across the 2015-17, 2020-21, and January 2024-November 2025 cycles. A sustained reclaim above that line would be the first mechanical signal the broader trend has turned.
-
What is Bitcoin's weekly RSI currently reading?
At the time of writing, the 14-week RSI was at 34.00, with BTC trading little changed over 24 hours near $63,000 — still well below the 41.5 dividing line.
-
What did Material Indicators analyst Keith Alan say about the RSI setup?
Alan said: "Bitcoin is below it, and still trending down. That does not mean price has to collapse, but it does mean the burden of proof is still on the bulls." He framed the current state as bearish bias intact, not necessarily a crash signal.
-
What is the next downside RSI trigger to watch?
Alan flagged 31.89 — the prior weekly RSI low — as the next level to watch. A break below that would mark a fresh leg lower in momentum and historically has lined up with the deepest phases of prior bear markets.
-
Why is the 41.5 RSI level considered a regime marker?
The 41.5 line on the 14-week RSI held throughout three prior bull markets and was broken during the most intense stretches of every major drawdown — late 2018, May-December 2022, and the recent slide. That cross-cycle consistency is what makes it a regime marker rather than just a momentum oscillator reading.
 CoinTelegraph
 TheBlock
 CryptoSlate
 Crypto Capital Venture
 Crypto Rank News
 WatcherGuru