








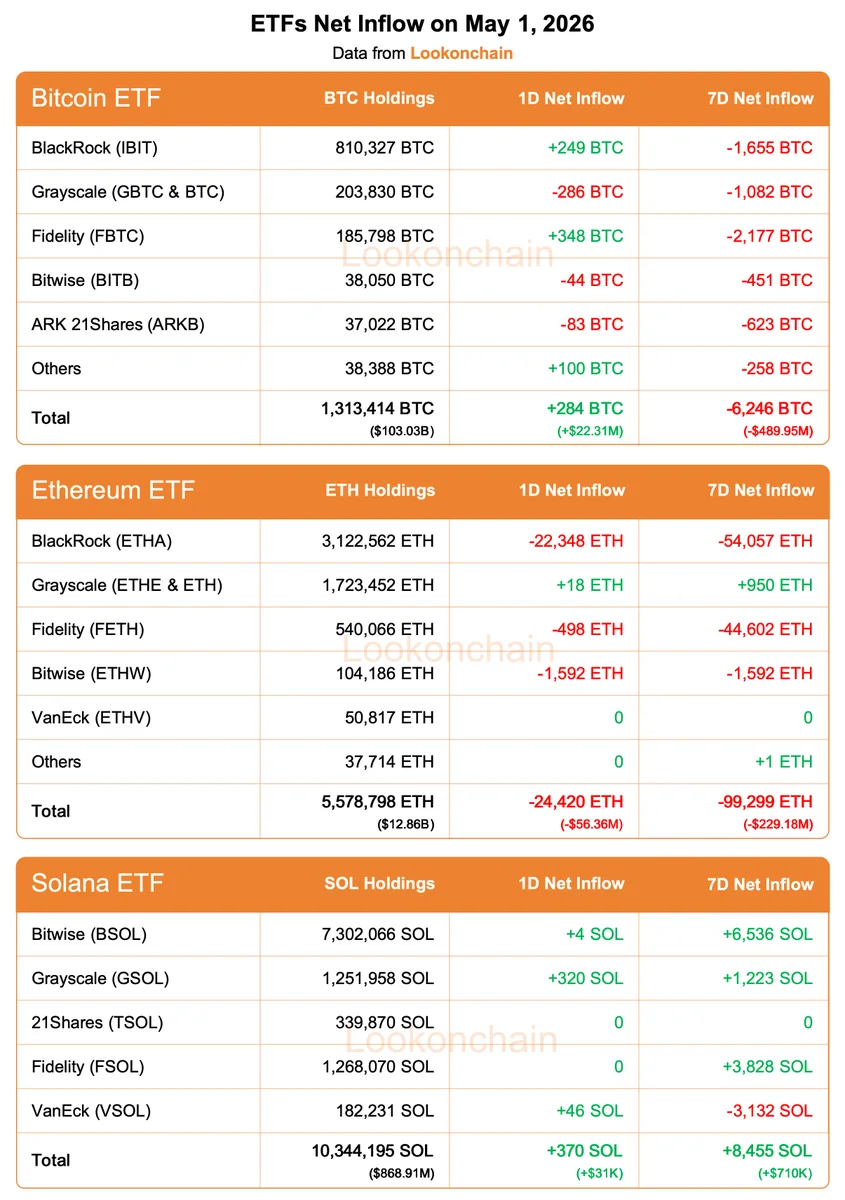
Spot Bitcoin ETFs pulled in a net $22.31 million (+284 BTC) on May 1, breaking a brutal week that had stripped $489.95 million (-6,246 BTC) from the funds over the prior seven days. The single-day print flipped green, but the weekly trend stayed firmly red.
Why it matters
A one-day inflow after a week of redemptions is the kind of print traders parse two ways. The bullish read: persistent buyers showed up at the level that flushed weak hands all week. The bearish read: the 7-day tape is still $490M underwater, and a single green session against that backdrop is noise, not signal. The split mirrors the broader tape — spot has held the bid through the weekly drawdown rather than accelerating the bleed.
Market impact
Ethereum ETFs ran the other direction on both windows. May 1 outflows hit -$56.36 million (-24,420 ETH), extending a 7-day streak of redemptions to -$229.18 million (-99,299 ETH). ETH fund flows continue to lag BTC by a wide margin, and the relative weakness in the ETH book is the same divergence that's been visible in spot pairs for weeks.
Solana ETFs stayed the quiet bright spot: +$31K (+370 SOL) on the day and +$710K (+8,455 SOL) over the week — small in absolute terms, but the only asset in the cohort printing green on both windows.



Frequently asked questions
-
Did Bitcoin ETFs have a net inflow or outflow on May 1?
Spot Bitcoin ETFs took in a net $22.31 million (+284 BTC) on May 1, snapping the losing streak with a single-day green print.
-
What was the 7-day net flow for spot Bitcoin ETFs?
The 7-day net flow for spot Bitcoin ETFs was -$489.95 million (-6,246 BTC), so the May 1 inflow was a bounce inside a still-red weekly trend.
-
How did Ethereum ETFs perform on May 1 and over the week?
Ethereum ETFs saw -$56.36 million (-24,420 ETH) in outflows on May 1 and -$229.18 million (-99,299 ETH) over the prior seven days — red on both windows.
-
Did Solana ETFs see inflows or outflows?
Solana ETFs posted +$31K (+370 SOL) on May 1 and +$710K (+8,455 SOL) over the prior week, making them the only asset in the cohort green on both windows.
-
What does a single-day green print mean after a red week for Bitcoin ETFs?
It is a split signal — bulls frame it as buyers stepping in at the level that flushed the week, bears frame it as noise against a $490M weekly outflow. The next session's flow is the tell.

 Crypto News
 Glassnode
 CoinDesk
 CryptoSlate
 CoinTelegraph
 TheBlock