








 Glassnode
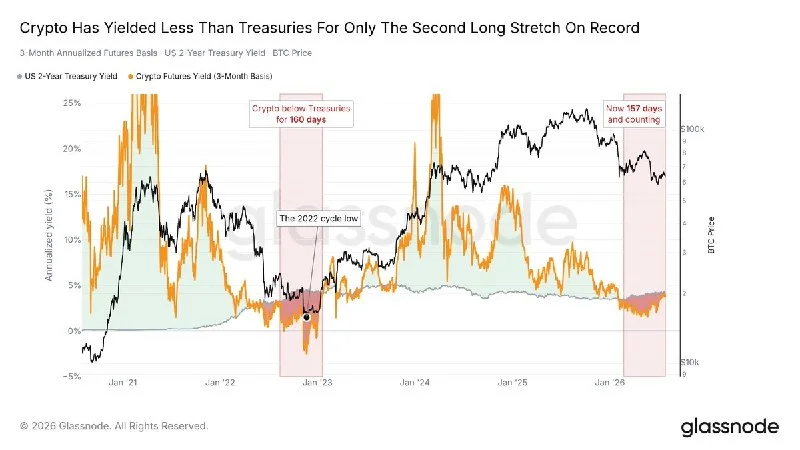
Treasuries have overtaken the crypto cash-and-carry trade, with the 2-year yield now sitting above the 3-month futures basis since February. Only one other stretch on record has run this long, from August 2022 into January 2023, and it ended at the cycle low. The spread is the mechanical reason the marginal bid has parked in cash while every downstream surface on Bitcoin has gone quiet at once.
The bond market has stopped pricing cuts and started leaning toward a hike. The 2-year yield has traded above the Federal Funds Rate since April, with the widest gap since November 2022. The FOMC decides today, and a cut would surprise most of that positioning. The dollar has been rallying since May, and Bitcoin is handling this rally worse than almost any since 2015, sitting deep in the red where the typical precedent would have it higher.
Why it matters
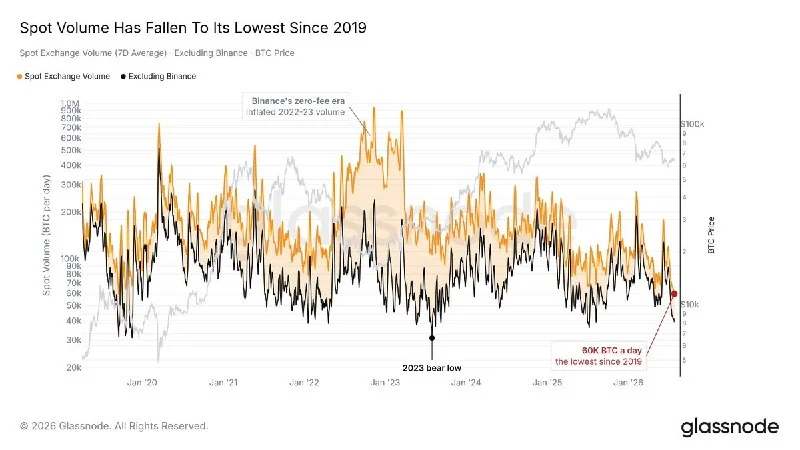
When Treasuries out-yield the basis, the desks that supply leverage, depth and volume to crypto have little reason to be here. The surfaces downstream of that one spread look exactly the way that prediction would expect: spot volume in coin terms has fallen to its lowest since 2019, exchange deposits and withdrawals are running together at their quietest combined pace in three years, and the ETF bid idled after a one-week flip positive in mid-July. Hedges were sold into the July 21 local high, the rally came with deleveraging, and the carried book has barely lifted off its low since.
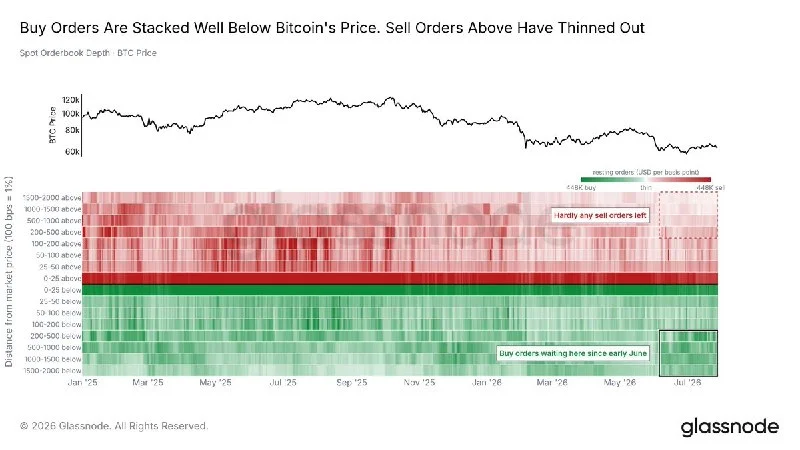
The order book tells the same story from a different angle. A persistent stack of bids has built between 2% and 20% below spot since early June, refreshed daily, while the offer side above has thinned to near its lowest of the past month. Buyers look willing, just not at these levels. Thin books cut both ways and tend to be how a quiet tape becomes a fast one.
Market impact
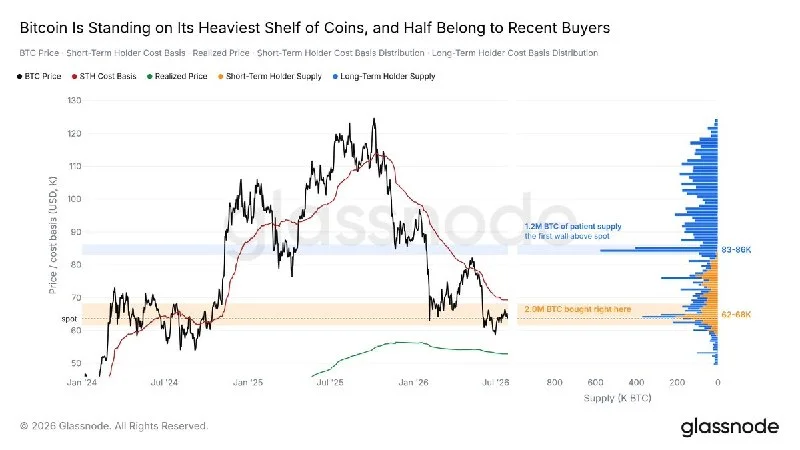
Bitcoin is trading inside the heaviest cost-basis cluster on the profile, the $62K to $68K band, split roughly evenly between short-term holders who bought into this year's decline and long-term holders who have sat through it. Overhead, the Short-Term Holder Cost Basis at $69K still decides the next leg, with the next real block of supply above it the long-term holder wall between $83K and $86K. By depth, this is the shallowest bear on record; by the clock of past cycles, it has spent only about three quarters as long below the 200-day moving average as the typical prior bear did.
Glassnode's Bitcoin Vector reads Risk Off, one band above capitulation, in what the model calls a tactical pause.

Frequently asked questions
-
What does "Treasuries out-yield the crypto carry trade" actually mean?
The 3-month futures basis is the annualized yield traders earn running a cash-and-carry (long spot, short futures). When the 2-year Treasury yield exceeds that basis, the same capital can earn more sitting in Treasuries, so the desks supplying leverage and depth to crypto have little reason to be active.
-
How rare is this Treasury-versus-basis inversion?
Only the second time on record. The first stretched from August 2022 into January 2023 and ended at the cycle low. The current stretch has run since February, making it the longest inversion on the chart outside that prior episode.
-
Why does the Bitcoin Vector reading "Risk Off" matter here?
Glassnode's Bitcoin Vector scores a basket of macro, on-chain and off-chain signals into a single regime label. A Risk Off read one band above capitulation is the practical form of everything else in the report: it is not asking anyone to step in front of the tape, and a bounce is unlikely to flip it without a regime…
-
What price levels define the next leg for Bitcoin?
The $62K to $68K band is the heaviest cost-basis cluster on the profile and acts as the floor; the Short-Term Holder Cost Basis at $69K is the line overhead that decides direction. A reclaim of $69K on returning ETF volume would mark the first sign of a regime turn, while a loss of the shelf with exchange inflows…
-
What is the FOMC doing today, and how does it fit the report's read?
The FOMC delivers its policy decision on the day the report was published. The bond market has already priced the next move closer to a hike than a cut, with the 2-year yield sitting above the Federal Funds Rate since April at the widest gap since November 2022. A cut would therefore surprise the curve, and the…
 CoinTelegraph
 CryptoSlate
 Crypto News
 CoinDesk