What implied volatility skew actually measures
Every options chain lists a separate implied volatility for every strike, even when those strikes share the same expiry. Plotted across strikes, those IVs form a smile or smirk, which is rarely symmetric. Implied volatility skew is the difference between the implied volatility of downside strikes and upside strikes at the same expiry, usually summarised by taking the IV of an out-of-the-money put and subtracting the IV of a matching out-of-the-money call.
The intuition is simple. Two options can have the same expiry and the same distance from the current spot price, but the market can price them at very different implied volatilities if traders care more about one direction than the other. Skew captures that asymmetry in a single number you can track over time, which is why professional traders stare at it as a sentiment proxy instead of as a model input.
In practice, the most-watched version is the 25-delta skew. A 25-delta put has roughly a 25% chance of expiring in the money, and the same is true of a 25-delta call on the upside. Taking the IV of the 25-delta put minus the IV of the 25-delta call gives a clean, comparable number. Deribit, the dominant venue for BTC and ETH options, publishes this in its volatility surface and on its analytics pages, which is why the metric shows up in almost every serious crypto derivatives dashboard.
Why puts usually trade richer than calls in crypto
If options markets were perfectly symmetric, puts and calls at the same delta would trade at the same implied volatility. They almost never do, and in BTC and ETH options the gap is unusually large compared to traditional markets. The reason is a combination of structural demand, behavioural bias, and the reality of how crypto portfolios get built and wrecked.
First, holders feel losses more painfully than they enjoy gains, a well-documented behavioural pattern. A 30% drawdown on a long BTC position hurts more than a 30% rally feels good, so traders and treasuries are willing to pay a premium to insure the downside. That demand pushes up put implied volatility relative to calls. In equities the same effect exists but is partly offset by institutional writers who systematically sell puts to collect premium, a flow that is far thinner in crypto, especially on Deribit before 2022.
Second, the history is brutal. The 2018 and 2022 BTC drawdowns each wiped out more than 70% of peak value. ETH has had multiple 80%+ drawdowns. Memory of those events shows up in the price of puts every single day. A 25-delta one-month put on BTC has historically traded at an implied volatility roughly 5 to 15 volatility points above the matching call, a gap that widens further into short-dated expiries during risk-off periods.
Third, leverage is one-sided. Most crypto traders run long exposure and hedge with puts rather than run short exposure hedged with calls. There is no large structural short-side community willing to sell calls cheap to harvest premium, which is the dynamic that keeps equity index skew tighter. The net effect is a persistently positive put-call skew, where downside strikes stay expensive even in calm markets.
How to read a 25-delta skew chart on Deribit
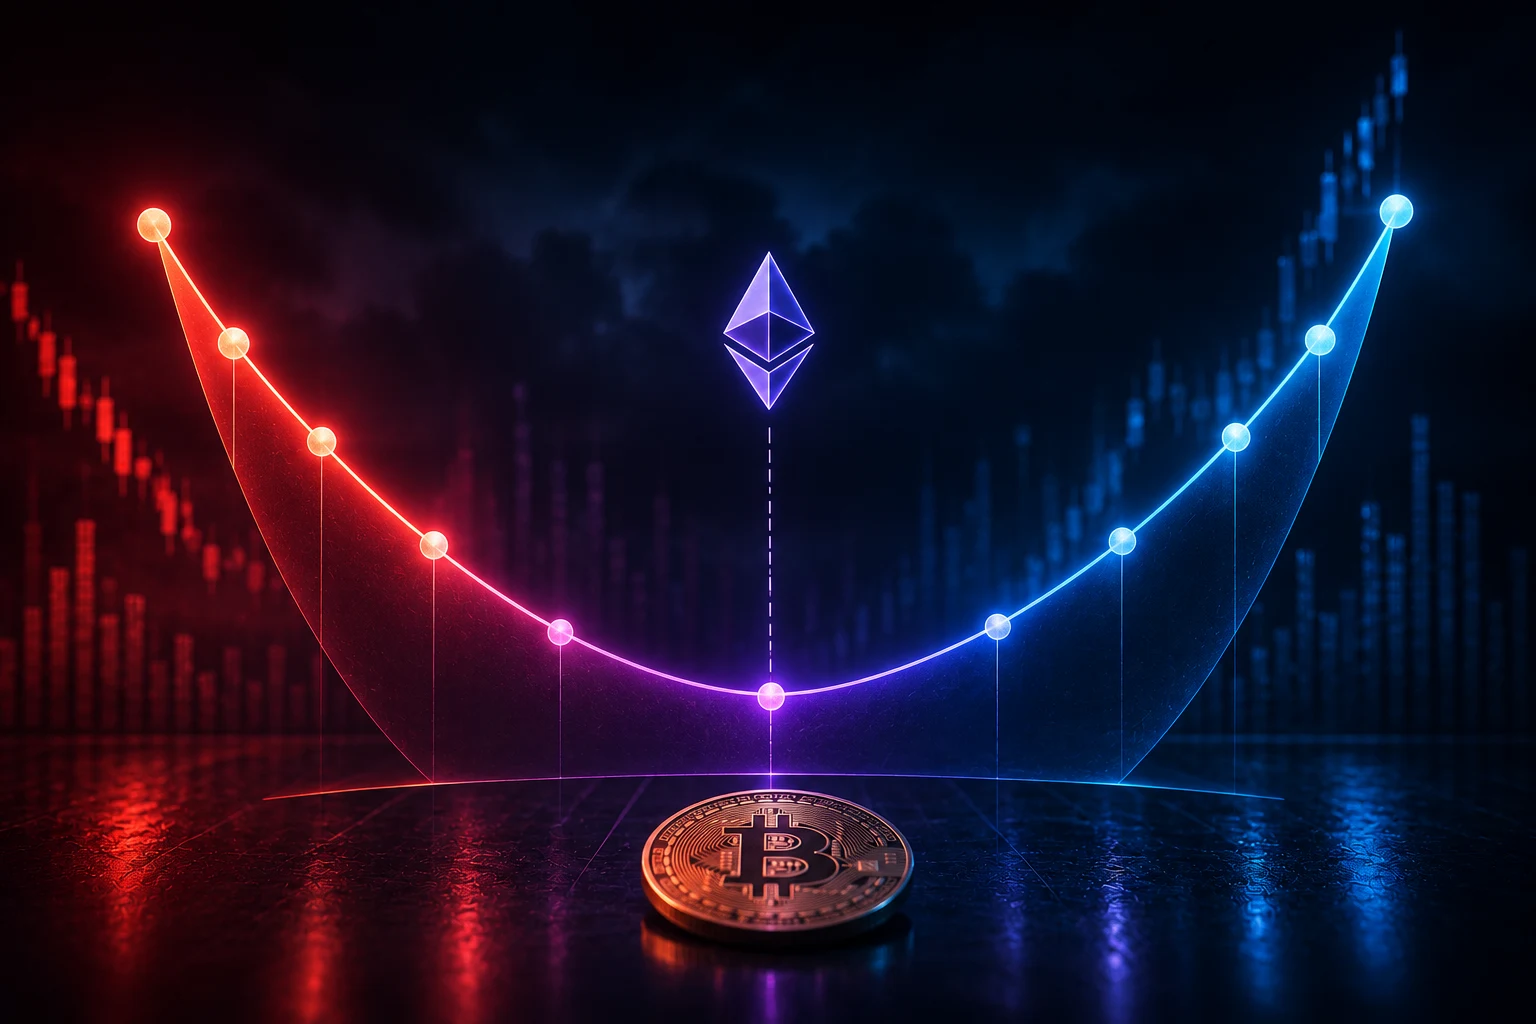
Open Deribit's analytics page and pull up the DVOL page or the options chain for BTC or ETH. You will see implied volatility plotted by strike. The y-axis is implied volatility, the x-axis is delta or strike, and the curve is almost always tilted. The left side, representing low-strike puts, sits higher than the right side, representing high-strike calls. That tilt is the visual signature of positive skew.
To read it mechanically, find the 25-delta put strike and the 25-delta call strike for the same expiry. Read the IV of each. Subtract call IV from put IV. If the result is positive, the market is pricing more downside fear than upside excitement. If it is near zero or negative, the market is paying roughly as much, or more, for upside calls as for downside puts. Most of the time in BTC and ETH you will see a number between 2 and 15 vol points on the positive side.
Time and tenor matter as much as level. Compare the 1-month 25-delta skew to the 3-month skew. If the front month is much steeper than the back month, the market is worried about something specific in the near term, often an upcoming event, a large options expiry, or a known macro release. If both are steep, the fear is more structural and persistent. A flattening skew that comes from puts getting cheaper rather than calls getting more expensive is the cleanest signal that fear is genuinely receding.
Watch the absolute level too. A 25-delta skew of 8 vol points in BTC is roughly average. A move above 15 is unusual and historically has coincided with sharp risk-off episodes. A move below 2 or into negative territory is also unusual and tends to mark periods where traders are chasing upside calls aggressively, often near local tops.
What a steepening skew signals
When skew steepens, puts are getting more expensive relative to calls. That does not mean the market is predicting a crash in a probabilistic sense, since options prices are heavily shaped by supply and demand, but it does mean traders are willing to pay up for downside protection. This is the closest thing crypto options markets have to a real-time fear gauge, and it often leads spot price action rather than follows it.
Steepening skew typically shows up first in the front expiries, then bleeds into longer-dated options if the concern sticks. A trader watching a Deribit chart might see the 1-week 25-delta put IV climb from 55% to 75% over a few days while the matching call IV barely moves. That is a market that has suddenly become more worried about a gap down than excited about a rally, and the most common trigger is a shock, an exchange incident, regulatory news, or a large liquidation cascade somewhere else in the market.
The other thing steepening skew tells you is that dealer hedging flows are likely to amplify any move down. Market makers who have sold those expensive puts to clients now need to hedge by selling spot or selling futures as the underlying drops. That dynamic can turn a normal dip into a faster, more violent one, which is exactly why watching skew is more useful than watching raw put prices alone.
What a flattening skew signals
Flattening skew is the mirror image. Puts are getting cheaper relative to calls, or calls are getting more expensive relative to puts, and the gap is closing. This usually shows up in two flavours, and they mean very different things.
The bullish flavour is fear genuinely receding. A trader or fund that was hedging a long position rolls off puts, stops rolling them forward, and lets them expire. As demand for puts falls, their IV drops, and the skew tightens even if call IV is unchanged. This kind of flattening tends to be slow and is a signal that the marginal hedger no longer feels the need for crash insurance, which historically has preceded durable rallies more often than sharp tops.
The dangerous flavour is euphoria or complacency. Calls start trading rich because traders are chasing upside through call buying, often financed by selling puts. This pushes call IV up while put IV stays flat or rises more slowly, which flattens the skew mechanically. In this case, the signal is not that fear has gone away, but that greed has crowded into the upside. Historically, sharp skew flattening driven by call-side demand has marked local tops more often than durable bottoms, and it is one of the most reliable late-cycle signals crypto options markets produce.
Distinguishing the two flavours comes down to where the IV is moving. If the flattening is driven by falling put IV with flat call IV, it is the bullish kind. If it is driven by rising call IV with flat or rising put IV, it is the euphoric kind. The level of absolute implied volatility matters too: a flattening skew from a high IV base is much more suspicious than the same flattening from a low base.
How skew drives dealer hedging flow
Skew is not just a sentiment indicator. It shapes the way market makers hedge, which shapes the tape. Understanding this loop is what separates reading skew from merely quoting it.
When a trader buys an out-of-the-money put from a market maker, the market maker is now short an option that gains value as spot falls. To stay roughly delta-neutral, the market maker sells a small amount of spot or futures as spot falls, and buys it back as spot rises. This is a mechanical effect, often called negative gamma, and it amplifies moves in the direction of the trade. A market maker short a lot of puts is effectively a forced seller on the way down.
Now layer skew on top. A steeply positive skew means a lot of those expensive puts are sitting on market maker books, especially on the front-month 25-delta strike. Every additional point of skew corresponds to more short-put gamma sitting in the system. When spot starts falling, the hedging flows from those short puts add to the selling pressure, which can push spot down further, which makes the puts more in the money, which forces more hedging. This is part of why sharp drawdowns in crypto often accelerate once they start, and why skew tends to peak right at or just after the moment of maximum pain.
The opposite happens when skew is flat or negative and the market is call-heavy. Market makers are short calls, so they hedge by selling rallies and buying dips, a pattern that smooths intraday moves and can turn a choppy tape into a grinding one. This is why choppy, low-vol grinding markets often coincide with flat or negative skew, and why sudden skew steepening tends to precede a regime change in how the market behaves intraday.
Crypto skew versus equity index skew
Comparing BTC skew to S&P 500 skew is instructive, because both markets have persistent positive put skew, but for slightly different reasons and at very different magnitudes.
In the S&P 500, 25-delta skew on the front month typically sits between 2 and 6 volatility points. In BTC, the same measure routinely trades between 5 and 15 volatility points, and ETH skew is often even higher because ETH has a deeper tail risk history per unit of market cap. Equity index skew has compressed over the years as the put-writing industry has grown and as systematic vol-control funds have provided a structural buyer of downside calls, balancing the market.
Crypto has no equivalent put-writing industry at scale, no equivalent vol-control buyer of upside calls, and a far more lopsided long-biased holder base. The result is a structurally steeper skew that moves more violently around events. A 5-point move in S&P 500 skew would be considered large. A 5-point move in BTC 25-delta skew over a week is unremarkable, and a 10-point move is a serious signal.
The other big difference is event clustering. Equity index skew tends to spike into known events like FOMC meetings and earnings season, then mean-revert quickly. Crypto skew spikes around exchange incidents, stablecoin depegs, regulatory shocks, and large liquidation cascades, which are harder to forecast and often asymmetric in magnitude. This is one reason crypto skew is treated as a real-time fear gauge, while equity skew is more often used as a positioning indicator.
Practical takeaways for a crypto trader
Skew is most useful as a context layer, not as a trade signal on its own. Treat it the way an equity trader treats the VIX term structure or the put-call ratio: read it alongside funding rates, open interest, and spot action, never in isolation.
Three concrete habits are worth building. First, bookmark the Deribit 25-delta skew chart for BTC and ETH and check it before sizing any short-dated options position. Second, note whether skew is steepening or flattening, and whether the move is driven by the put side or the call side. That tells you whether fear is rising, fear is receding, or euphoria is building. Third, remember that dealer gamma around steep skew makes downside moves more violent, so tight risk controls matter more when the put side of the market is rich.
None of this is investment advice. Skew tells you what the options market is pricing, not what will happen. Treating it as a fear gauge is a useful frame, but it is one input among many, and it can stay steep for weeks without a crash, or compress sharply right before a crash. The skill is reading it in context, not worshipping it.
Stay ahead of crypto options sentiment
Crypto options markets move fast, and skew can flip from 8 vol points to 18 in a single session when a liquidation cascade hits. Tracking 25-delta skew, funding, open interest, and the news driving them manually is a losing game. Zippfeed surfaces crypto options and derivatives headlines with sentiment scoring tagged bullish, neutral, or bearish, plus an importance rating, so you can see when a story is likely to move skew and price action before the chart catches up.


 WuBlockchain
 CryptoSlate
 Glassnode
 WatcherGuru
 Altcoin Daily