What the Fear and Greed Index actually is
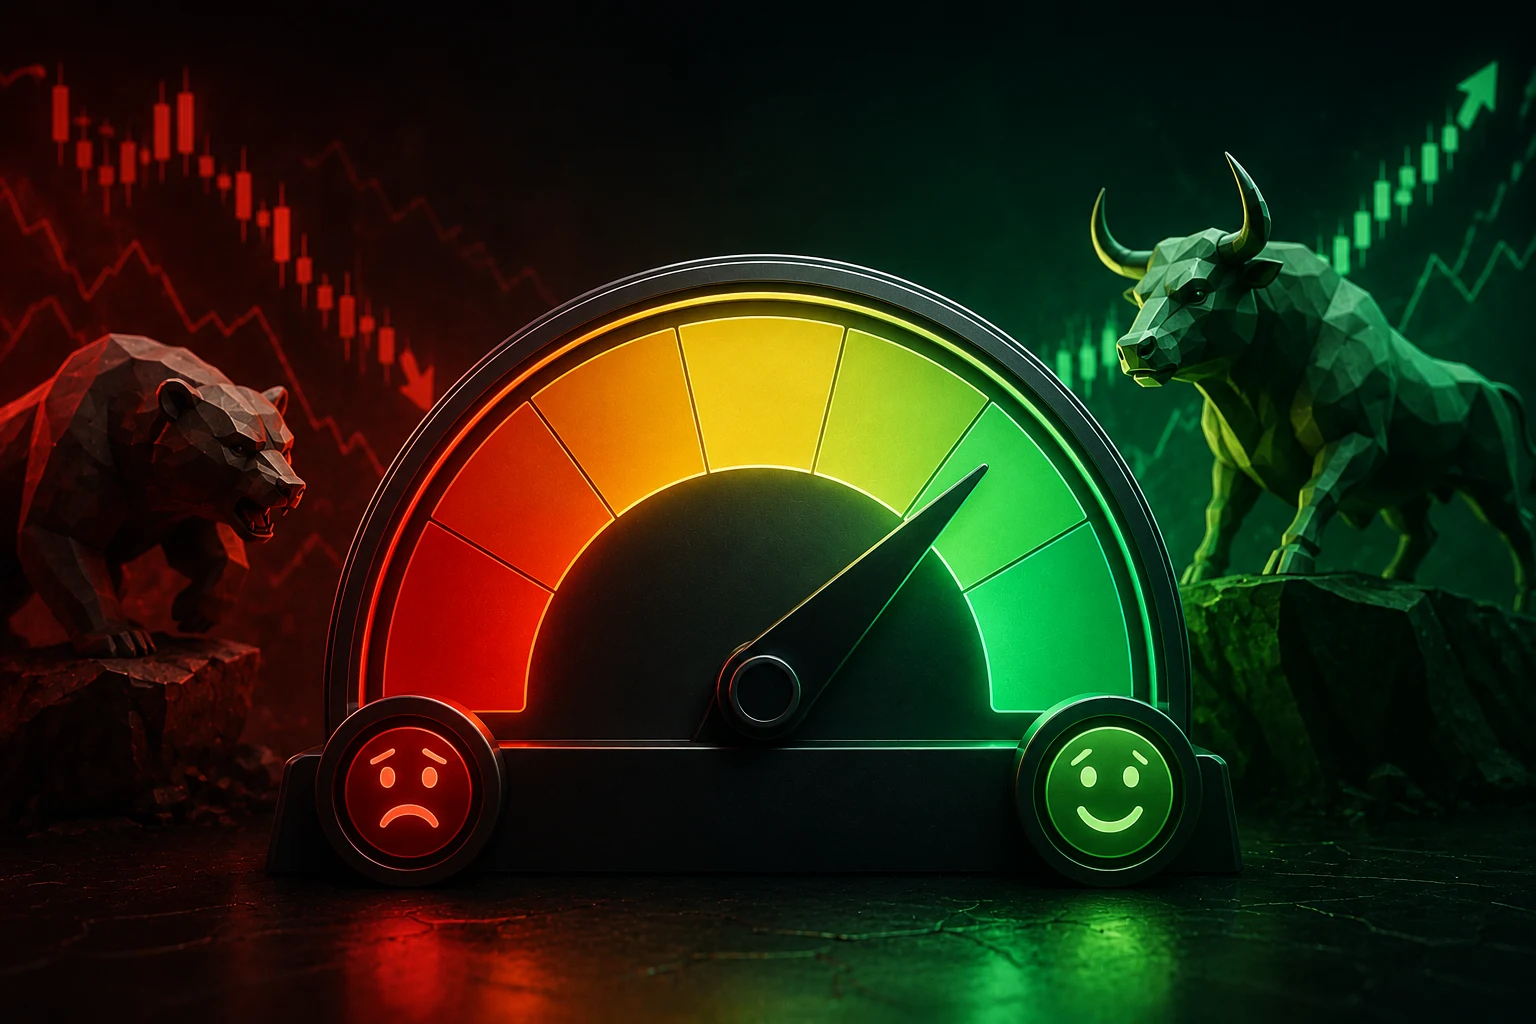
The crypto Fear and Greed Index was launched in 2018 by the data site Alternative.me as a daily sentiment score for the Bitcoin and wider crypto market. The idea is borrowed from CNN's older Fear and Greed index for stocks: when investors are fearful, they sell into weakness; when they are greedy, they chase. The crypto version collapses that mood into a single 0 to 100 number, where 0 means "extreme fear" and 100 means "extreme greed."
Each day, the index pulls fresh inputs, normalizes them so they fit on the same scale, and weights them into one score. The classic display shows the current value, the day-over-day change, and a colored bar from red to green. Alternative.me also publishes a 30-day and 90-day average, because the daily number is noisy on its own.
Two things matter for a new trader to internalize. First, the index describes the mood of the market, it does not forecast price. Second, only the extreme ends of the scale tend to carry useful information. A reading of 50 on a Tuesday tells you almost nothing; a reading of 15 after a sharp drop, or 88 after a vertical rally, is the kind of print that historically marks investor capitulation or euphoria. Treat the index as a sentiment lens, and most frustration with it goes away.
What the five components measure, and where they break
The Fear and Greed Index is not a single survey. It is a basket of five different inputs, each trying to capture a different angle of crowd psychology. Knowing what is inside the basket is what separates a trader who can use the index from one who just watches the bar color change.
Volatility (weight: 25%)
This component compares current 30-day and 90-day Bitcoin volatility to its own history. Big, sudden drawdowns push the score toward fear; calm, orderly trading pushes it toward greed. The intuition is that falling prices are usually associated with choppier moves, while grinding bull trends feel calmer.
The catch is that volatility is itself lagging and path-dependent. It captures how wild the last month felt, not whether tomorrow will be wild. After a sharp flush, volatility can remain high for weeks even if price is range-bound, which means the volatility sub-score can keep the overall reading in fearful territory long after the actual selling has dried up.
Market momentum and volume (weight: 25%)
This is a simple comparison of current BTC volume and momentum against its rolling averages. When volume and upward momentum both look above average, the market is reading as greedy; when both are below, it reads as fearful.
The honest framing is that this component is essentially price and volume dressed up as sentiment. If BTC has rallied hard with high volume, this sub-score will almost certainly say "greedy"; if it has slid on thin volume, it will lean fearful. Because it is so tightly bound to price action, it gives you very little information that the chart itself does not already show.
Social media activity (weight: 15%)
This part counts and weighs crypto-related posts on X (formerly Twitter), Reddit, and a few other platforms. A spike in volume and engagement around Bitcoin or Ethereum, especially with bullish keywords, nudges the index toward greed; a quiet social feed nudges it toward fear.
The limitation is that social chatter is reactive. Bots, paid engagement, and recurring hype cycles distort the signal. Engagement also spikes disproportionately during crashes because fear is a stronger motivator than quiet optimism, so the "extreme fear" you see on a bad day is partly an artifact of people rushing to post about the drop.
Bitcoin dominance (weight: 10%)
Bitcoin dominance is BTC's share of the total crypto market cap. Rising dominance is read as fear, because money is rotating into the perceived safety of Bitcoin and out of altcoins. Falling dominance is read as greed, because capital is spreading into smaller, riskier assets.
This component is the most structural of the five. A multi-month rise in dominance through 2022 and into 2024 reflected a sustained, cautious market regime, not a one-day mood swing. It is the part of the index most likely to confirm a regime shift rather than a daily headline.
Surveys (weight: 25%)
Alternative.me runs a weekly poll asking visitors whether they feel bullish or bearish in the next 30 days. This is the only directly self-reported component. Responses are weighted into the basket alongside the four quantitative inputs.
Surveys have obvious flaws. The pool is self-selected, often small, and dominated by retail traders who use the index in the first place. During clear bull or bear regimes, the poll essentially asks a biased sample the question they have already answered with their money. Treat this slice as an attention proxy more than a hard data point.
Why extreme readings are more signal than mid-range ones
Walk through any chart of the Fear and Greed Index and a pattern jumps out. The score spends most of its time between 30 and 70. It flirts with extremes only occasionally, and it tends to do so near the end of major moves. The same pattern shows up across long equity sentiment indices like the VIX or the AAII bull-bear spread: sentiment oscillates around neutral, and only the tails carry signal.
There is a clean statistical reason. The index is built from several inputs that are themselves autocorrelated, meaning they tend to stay near their recent values. Volatility does not snap from low to high overnight. Surveys do not move five points a day. So if the current reading is 65 and the 30-day average is 62, you are essentially being told the mood is "slightly above average," which is the kind of information a candle already encodes.
Extreme prints are different. They imply that several inputs are aligned at the same tail simultaneously. Volatility is spiking and surveys are bearish and volume is heavy and dominance is rising, all at once. That kind of alignment is rare and tends to coincide with points where margin is being forced out or, on the other side, where retail is fully allocated and out of dry powder. Those are the moments when the index historically lines up with a turning point in the trend, which is why most disciplined traders will only react at the ends of the scale.
The five failure modes worth knowing before you act on it
Every new tool has failure modes, and the Fear and Greed Index is no exception. Before using the score to size a trade, make sure you can name the situations where the indicator is most likely to mislead you.
Failure mode 1: sentiment can stay extreme for weeks
During strong trends, the index often stays pinned near one extreme. Through long parts of the 2020 to 2021 bull run, the reading sat in the greedy zone for months on end without rolling over. Through the 2022 bear market, it spent weeks deep in fear even on days when BTC flatlined. Anyone using the index as a strict contrarian trigger would have bought through the entire 2022 slide and sold too early on the 2021 ramp.
Failure mode 2: mid-range readings carry almost no information
A score of 52 today after a week of 50s confirms what price already shows. It is a sentiment resting heartbeat. Treating these middling prints as actionable is a fast route to overtrading, because every small wiggle looks like a signal when it is just noise around the average.
Failure mode 3: contrarian-only interpretation can wreck a trend
The classic pitch is "fear means buy, greed means sell." That framing is half-true and quietly dangerous. Markets can trend in the same direction as sentiment for surprisingly long stretches, and a strict contrarian reading can put a trader against every leg of that trend, with mounting losses and a slow erosion of conviction. The index works best as a regime flag for when the crowd is fully committed, not as a per-bar timing tool.
Failure mode 4: the components lag price moves
Volatility, momentum, dominance, and surveys all react to what has already happened. Even the social media component, which feels fast, only reports on chatter that has already spiked. By the time the index prints an extreme fear or extreme greed reading, the defining move is usually a few sessions old. The index confirms turning points; it does not lead them.
Failure mode 5: ETF flows have changed what the index measures
Since U.S. spot BTC and ETH ETFs launched, a meaningful share of net buying and selling now flows through regulated, dollar-based products rather than on-chain wallets or offshore exchanges. That capital is slower, larger, and less reactive to social chatter, so the index increasingly correlates with weekly ETF creation and redemption flow as much as it does with Reddit posts. Useful, but worth knowing: the index is partly a mirror of institutional positioning now, not a pure retail-mood thermometer.
How to use the index without fooling yourself
The honest framework is to treat the Fear and Greed Index as one of three layers of context, never a trigger on its own. The first layer is structure, which is the higher-timeframe chart pattern, key support and resistance, the location of funding rates, and open interest on perpetual swaps. The second layer is flow, which is net ETF inflows, exchange net positions, stablecoin supply changes, and stablecoin minting or burning activity. The third layer is sentiment, which is where the Fear and Greed Index lives, alongside things like the CryptoBull or VIX-equivalent indices and aggregated long or short ratios.
When two or three of these layers agree, the trade has weight. When sentiment screams fear and yet flows are quietly positive and structure is intact, the more useful read is that fear is the wrong emotion for the regime, not that it is time to lean contrarian. Conversely, when sentiment is euphoric and flows are thinning out, that is when a positioning blow-off becomes more probable.
One practical habit is to watch the index in pairs: read the daily print alongside the 30-day moving average. If the daily is at 22 but the 30-day average is at 35, fear is escalating, which is more informative than the absolute 22 number alone. If the daily is at 22 and the 30-day average is at 24, fear has been with us for weeks and a further capitulation wash is more likely than an instant bounce.
What a reading actually tells you on any given day
A useful exercise for any new trader is to translate the index into a sentence rather than treating it as a number. Below is a working vocabulary that many trading desks use internally.
- 0 to 24, "extreme fear": The crowd is washed out and risk appetite is low. Historically a warning that the easy fear-trade is already over; look at flows and structure before leaning contrarian.
- 25 to 49, "fear": The market is uneasy. This zone can persist for weeks in downtrends. Treat as context, not as a signal.
- 50, "neutral": The mood is balanced. Useful only as a baseline; in practice it rarely stays here for more than a day or two.
- 51 to 74, "greed": Risk is being taken willingly. Can persist for months in strong bull markets, so do not assume a top is near.
- 75 to 100, "extreme greed": The crowd is fully allocated. Historically the zone where the next 5 to 10 percent of upside is decided by whether fresh flow arrives.
The key discipline is to update that sentence every time the 30-day average shifts by 5 or more points, not every time the daily wiggles. That single habit reduces whipsaw trades sharply, because it forces you to react to persistent mood, not headline noise.
How to follow Fear and Greed the smart way
The Fear and Greed Index changes daily, prints swing on every regime shift, and the most useful extremes are rare enough that you can miss them if you are not tracking them on purpose. Watching the score by hand, while also watching flows, structure, and the news cycle, is a losing game for most traders. Zippfeed surfaces crypto Fear and Greed Index headlines alongside sentiment scoring (bullish, neutral, or bearish) and an importance rating, so you can see when mood shifts align with real flows instead of guessing whether today's print actually matters.


 WuBlockchain
 CryptoSlate
 Glassnode
 WatcherGuru
 Altcoin Daily