Why stablecoins depeg, and why catching it early matters
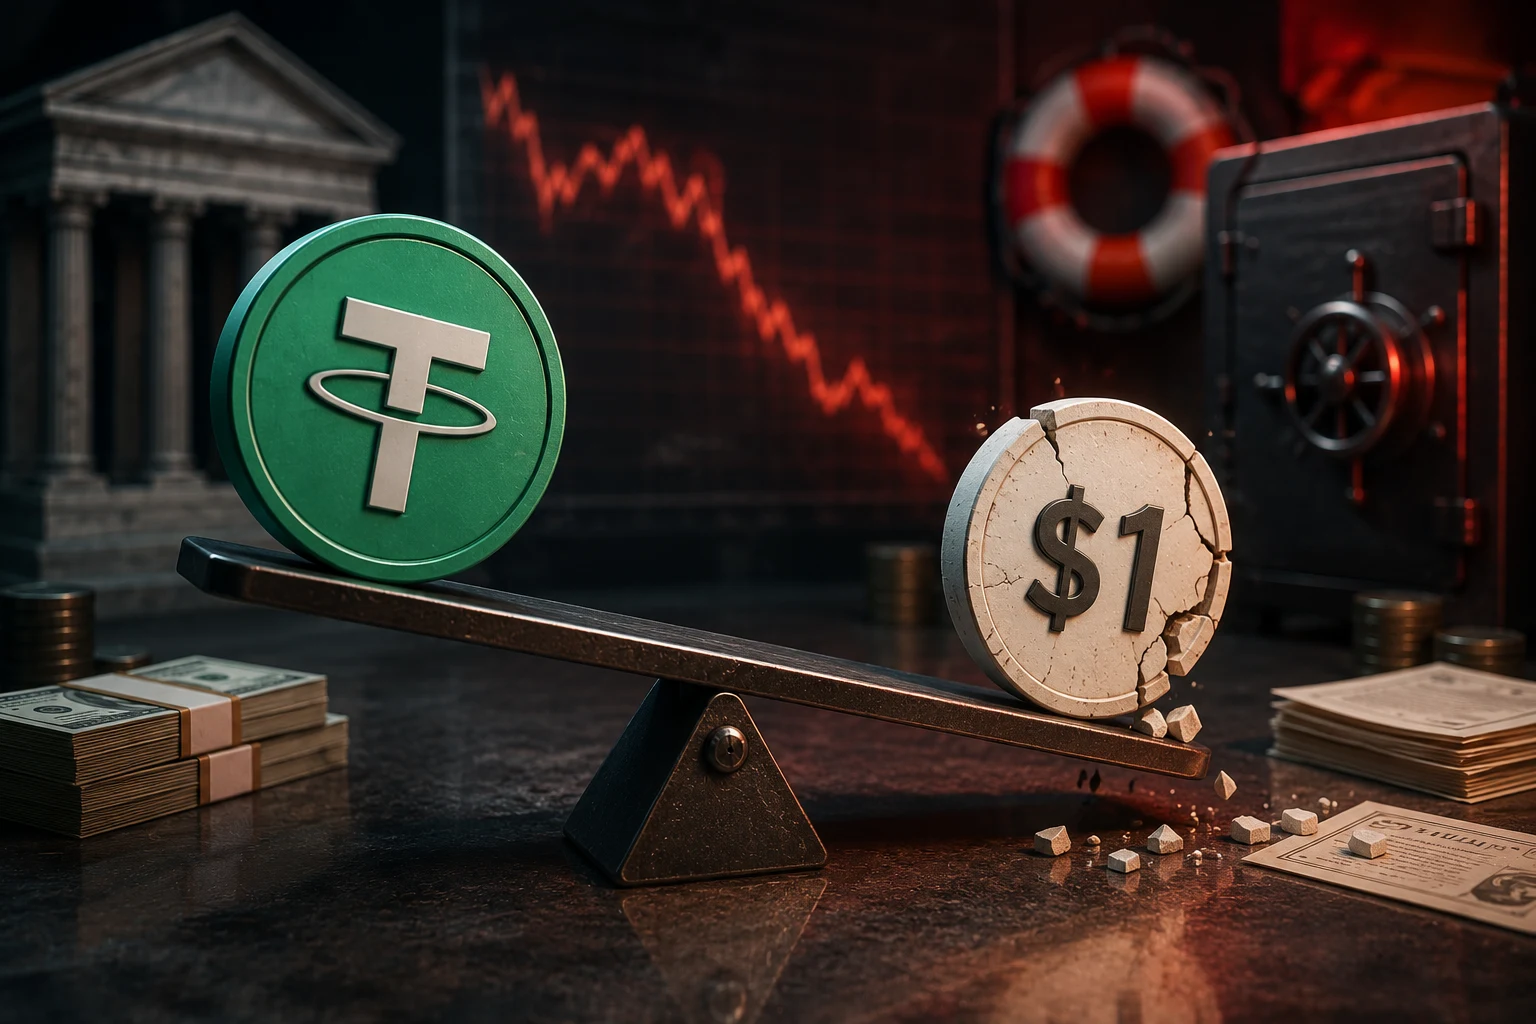
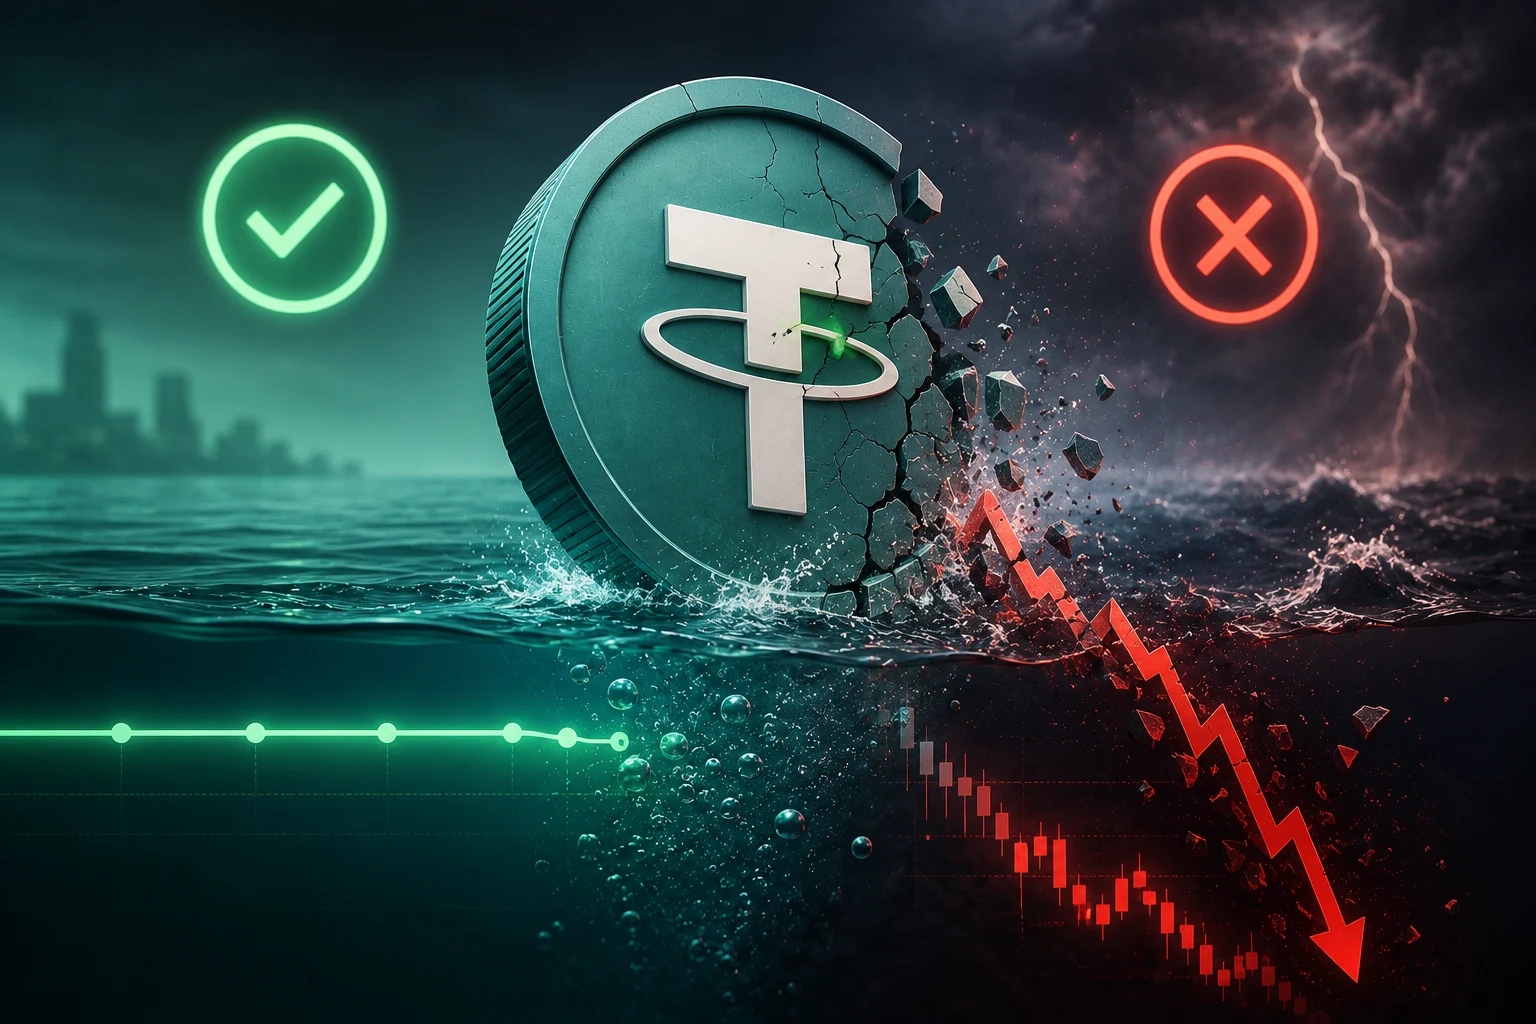
A stablecoin is supposed to stay worth one dollar. Most of the time it does, because issuers hold cash, short-dated Treasuries, or crypto collateral that can be redeemed for dollars on demand. A depeg is what happens when that confidence breaks faster than the issuer can print or burn tokens to meet demand, so the market price drifts away from one dollar on crypto exchanges.
For traders and DeFi users, even a small depeg is expensive. A USDC trading at $0.98 on a DEX is a 2% loss the moment you receive it, and a 2% gain you missed by exiting late. Bigger depegs, like the one USDC suffered in March 2023, can wipe out leveraged positions, cause lending protocols to liquidate borrowers, and freeze withdrawals across an entire DeFi stack. The people who got out before the curve paid nothing. The people who got out after absorbed the slippage.
That is why this is a checklist article rather than a primer on stablecoin design. If you already know what USDT and USDC are, what really matters is the small set of dashboards and wallet addresses that warned traders before each of the last three major depeg events. The angle here is risk-first: assume the signal will be imperfect, assume you will be slow, and size your exposure so that being wrong is annoying rather than ruinous.
What actually happened during past depegs
Three real episodes are worth studying because they were all visible on-chain well before the price broke.
USDC during the SVB collapse, March 2023. Circle disclosed that roughly $3.3 billion of USDC reserves sat at Silicon Valley Bank. When SVB was placed into FDIC receivership on March 10, 2023, USDC traded down to about $0.87 on Curve within hours and stayed below the peg for roughly three days. The on-chain warning was not subtle. The 3pool composition shifted hard toward USDC as holders rushed to exit, and Circle's transparency page stopped updating for a day while the company waited for clarity on the uninsured deposit recovery. Anyone watching Curve or the issuer's wallet activity saw the stress before Curve itself did.
USDD during the Terra contagion, June 2022. USDD is the algorithmic stablecoin of the Tron network, backed partly by TRX and other crypto collateral. As Terra's UST collapsed in May 2022 and the broader credit environment tightened in June 2022, USDD slipped to about $0.93 on SunSwap and stayed below the peg for weeks. The on-chain signal was a slowly thinning liquidity pool on the USDD/USDT SunSwap pair combined with rising borrow rates on JustLend, the Tron money market. The price drift gave holders plenty of warning, which is part of why the depeg was shallow rather than catastrophic.
USDe basis blow-ups, 2024. Ethena's USDe is a 'synthetic dollar' that holds perpetual futures to earn the funding rate. The peg works most of the time, but in April 2024 and again in late 2024 the basis trade unwound violently. When funding flipped negative, USDe's backing started losing money and the token traded at $0.96 to $0.99 on DEXs. The on-chain tell was a combination of falling insurance fund balances in Ethena's wallets, rising open interest on the short leg, and DEX premium data that moved before the protocol's published APY adjusted.
The common thread is that none of these depegs came out of nowhere. Each one had visible mechanical pressure building in liquidity pools, in issuer wallets, or in redemption systems for hours, sometimes days, before the price actually broke.
Signal one: DEX premium and discount versus the peg
The single fastest signal is also the simplest. If USDC trades at $1.01 on Coinbase but $0.99 on Uniswap, arbitrage should close that gap within seconds. When the gap stays open for minutes, the peg is already under stress.
How to read it. A persistent DEX discount (USDC trading below $1.00 on Uniswap or Curve) means holders are dumping stablecoins into DeFi liquidity, often because they cannot exit through the issuer fast enough. A persistent DEX premium (USDC above $1.00 on DEXs) usually means the opposite: traders want stablecoins on-chain and cannot get them through Circle minting fast enough. Both are early warnings. The first signals a bank run. The second signals a redemption queue backup.
Free tools for this signal.
- DexScreener. Search for 'USDC/USDT' or 'USDe/USDC' pairs and sort by liquidity. A thin pool is one that flips fast.
- Curve UI. The pool view shows live price against the peg, plus the size of each side of the pool.
- CoinGecko and CoinMarketCap. Their 'markets' tab lists DEX prices alongside CEX prices. A spread between the two is the cleanest visual alarm.
What to ignore. A 5 to 20 basis point wobble that closes in under a minute is normal arbitrage noise. Worry when the gap is wider than 30 basis points and stays open for more than ten minutes, or when multiple DEX pools show the same direction simultaneously.
Signal two: Curve 3pool and stableswap imbalance
Curve is where the smart money parks large stablecoin balances, because slippage is minimal and the pools are deep. That depth is exactly why Curve is also the place where fear shows up first. When holders want out, they dump into Curve. When the pool becomes one-sided, the next arbitrageurs have to push the price further to restore balance.
The classic signal is the Curve 3pool (USDC/USDT/DAI). When it goes from roughly balanced (33/33/33) to something like 60% USDC, 20% USDT, 20% DAI, that means USDC is the asset people do not want to hold. During the SVB episode, the pool briefly skewed above 70% USDC, which is what dragged USDC to $0.87. The same logic applies to stableswap pools like USDe/USDC and USDD/USDT. A pool that is becoming one-sided in a way that matches a discount on the price is a strong depeg warning.
How to read it. Open the Curve UI for the relevant pool and look at the gauge weights. A pool that is becoming dominated by the depegging token means the peg is failing. A pool that is becoming dominated by a competing token (for example, USDT gaining share because USDC holders are fleeing into Tether) means the issuer is in trouble but the broader stablecoin market is still functioning. Either way, you are watching a real-time stress test.
Free tools for this signal.
- Curve UI (curve.fi). Each pool page shows live balances and the implied price against $1.
- DefiLlama. The 'DEX' section tracks Curve pool TVL over time. A sudden drop in TVL inside a specific pool is a red flag.
- Frankendata's Curve monitor. This community dashboard plots the composition of the 3pool over time, so you can see the skew developing minute by minute.
What to ignore. A 2 to 5 percentage point shift in pool composition that reverses within an hour is normal flow. Worry when one asset exceeds 50% of the pool and is still climbing, or when the implied price inside the pool moves more than 20 basis points away from $1.
Signal three: mint and redemption queue length
Most dollar-backed stablecoins let authorized users mint new tokens by depositing dollars, and redeem them for dollars by returning tokens. When redemption queues grow, it means holders are trying to get cash out faster than the issuer can process. When mint queues grow, it usually means the opposite, but a jammed mint queue can also reflect a banking issue on the issuer's side.
The clearest recent example was USDC in March 2023. Circle paused redemptions while SVB was in receivership, which is why the peg broke on-chain rather than being arbitraged away through Circle itself. Anyone watching the public mint and redemption endpoints would have seen the slowdown before the price broke.
How to read it.
- USDC. Circle publishes real-time reserve data on its transparency page. When the page stops updating or shows unusual flows, that is a signal.
- USDT. Tether publishes attestations, but with a lag. The real-time signal is wallet activity from Tether's treasury addresses on Etherscan, Tron, and Arkham.
- USDe. Ethena publishes daily reserve and backing reports. A divergence between the published APY, the funding rate, and the protocol's insurance fund balance is the signal that the basis trade is unwinding.
Free tools for this signal.
- Circle's transparency page. Live reserve composition, updated daily, with a public attestation.
- Arkham Intelligence. Lets you tag and monitor known issuer wallets across chains.
- Ethena's transparency dashboard. Live APY, backing composition, and insurance fund size.
What to ignore. Scheduled maintenance windows or attestation lag under 24 hours. Worry when redemptions are paused outright, when the issuer's published reserves stop matching on-chain balances, or when the insurance fund shrinks faster than the protocol's income can explain.
Signal four: issuer treasury and reserve wallet outflows
Behind every dollar-backed stablecoin is a treasury wallet. When that wallet starts moving unusually large amounts, something has changed. Either the issuer is preparing for a redemption surge, or a counterparty is being paid out, or reserves are being repositioned because the issuer is worried about a specific custodian.
How to read it. Watch the known treasury addresses for each issuer. For USDC, that includes the Circle Treasury wallet on Ethereum. For USDT, it includes the Tether Treasury on both Ethereum and Tron. For USDe, it includes the protocol's operations wallet and insurance fund contract. Big outflows from these wallets into exchange deposit addresses, into lending protocols like Aave, or into mixing services are early signs of stress.
Real example. In the days before the SVB depeg, several on-chain analysts noted that Circle's primary reserve wallet had unusual flows. Once SVB failed, the same wallet was effectively frozen, which is why redemption could not absorb the selling pressure. Anyone monitoring the wallet activity in advance saw the positioning.
Free tools for this signal.
- Etherscan and Tronscan. Bookmark the labeled treasury addresses and check the transaction feed.
- Arkham Intelligence. Maintains labeled entity pages for Circle, Tether, and most major issuers.
- Nansen and Dune. Have public dashboards tracking stablecoin treasury flows across chains.
What to ignore. Routine treasury rebalancing under $100 million is normal. Worry when a single transaction moves more than 10% of the issuer's known reserves, or when multiple outflows hit exchanges or DeFi protocols within a short window.
Putting the four signals into a real workflow
Individually, each of these signals is noisy. Combined, they form a usable early-warning system. The workflow below is what experienced DeFi users ran during the SVB episode, and it generalizes to any future stress event.
Step one: skim the DEX premium
Open DexScreener for the top three pairs of whichever stablecoin you are holding. If more than one is trading 20 basis points or more off the peg, that is your first signal to investigate.
Step two: check the Curve pool
Open the relevant Curve pool. If composition is shifting toward the asset you are worried about, the depeg is real, not just a thin-pool artifact.
Step three: confirm with the issuer's transparency data
If the issuer has a live transparency page, check it. If the page is down, the data is stale, or redemptions are paused, that is a major signal on its own.
Step four: scan the treasury wallet
Check Arkham or Etherscan for the issuer's labeled wallets. Unusual outflows to exchanges or DeFi protocols add another data point.
Step five: decide and act
Two signals together is a warning. Three is a strong warning. Four is a depeg in progress. If you have any meaningful exposure, the time to exit is when you see signal two, not when the price on Coinbase breaks. By the time mainstream news catches up, the DEX liquidity is already gone.
This workflow is not a guarantee. Even with all four signals lit, slippage during a true bank run can be severe. That is why position sizing matters as much as signal reading. Never hold more of a single stablecoin than you can afford to redeem slowly over several days if the worst happens.
How to follow stablecoin risk without staring at charts
Stablecoin stress rarely gives you a full day of warning. Sometimes it gives you ten minutes. Tracking the right dashboards, the right Curve pools, and the right treasury wallets manually is a losing game, because the data is scattered across a dozen sites and chains. Zippfeed surfaces stablecoin headlines with sentiment scoring (bullish, neutral, or bearish) and an importance rating, so you can see in one feed which issuer is under pressure before the rest of the market notices. stablecoin depeg coverage on Zippfeed is built specifically for the workflow above, with each story tagged by issuer and by the on-chain signal that drove it.



 CoinDesk
 CryptoSlate
 WuBlockchain
 TheBlock