








 Crypto News
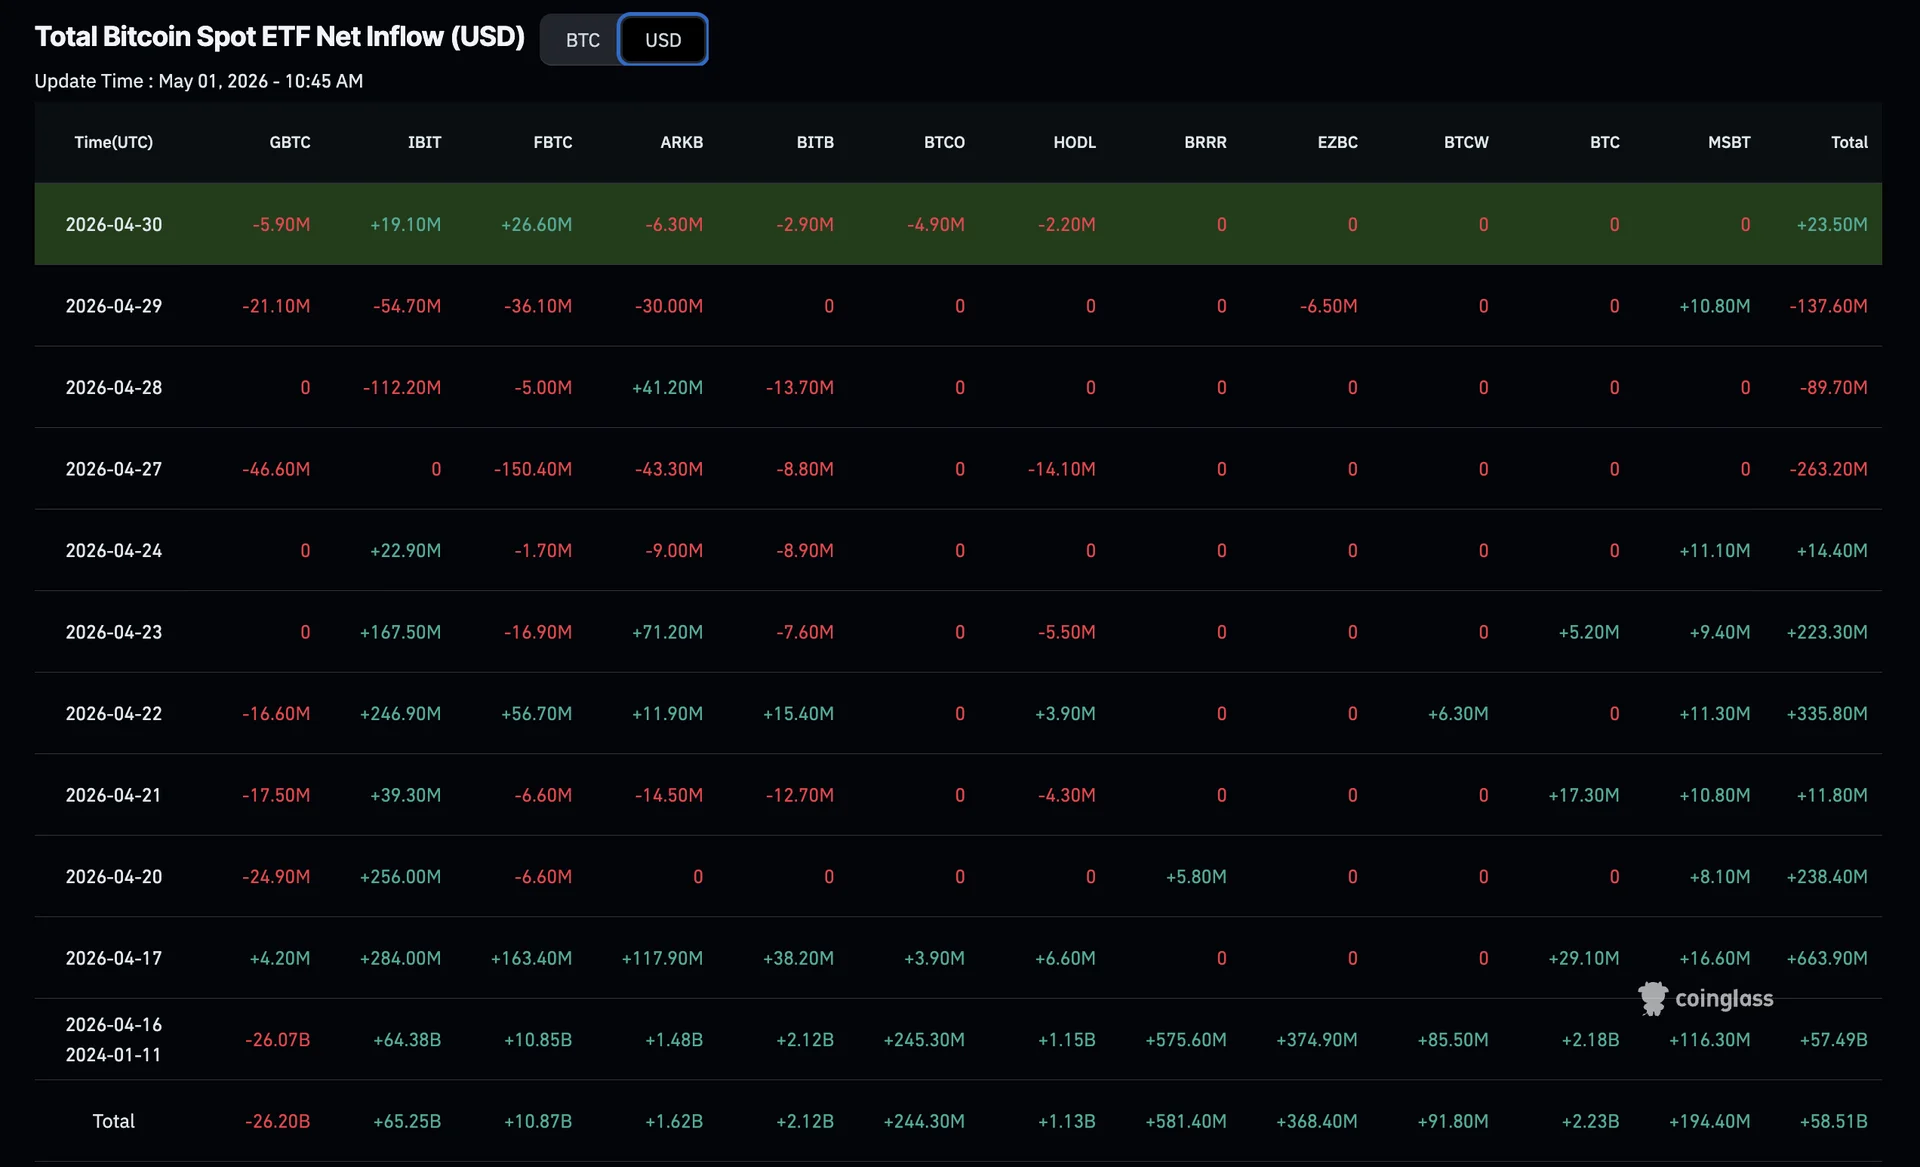


Bitcoin's spot Cumulative Volume Delta (CVD) climbed 199.1% over the prior week, jumping from $18.3 million to $54.8 million, with parallel perpetual CVD rising 174.7% to $315.1 million. The simultaneous expansion across both venues confirms aggressive spot-market buying rather than a futures-driven short squeeze. BlackRock's IBIT gained 1.33% in the prior session as institutional crypto demand re-emerged after a three-day stretch of net ETF outflows.
Why it matters
The composition of the move matters more than the headline percentage. January's rally was leverage-led, with perpetual CVD dwarfing spot CVD — a structure prone to violent flushes when open interest unwinds. The current setup inverts that pattern: spot CVD is rising in lockstep with leverage, but spot is the leading indicator. Open interest has recovered to $25 billion, which Bernstein analysts flagged as a sign of returning leverage, yet the move is being absorbed rather than chased. ETF flows are providing the demand layer that holds Bitcoin above $78,000.
Market impact
Bitcoin is trading around $77,000 intraday after reclaiming that level as support, with CVD holding above its moving averages — the minimum confirmation for bullish conviction. RSI sits elevated but not yet at overbought extremes, leaving room for continuation. A weekly close above $75,000 opens the path toward $80,000 and the $82,000 on-chain resistance cluster; a break below puts the real floor near $72,000. Macro tailwinds remain supportive: U.S. equities closed April at new all-time highs on strong Alphabet and Caterpillar earnings, and BTC's tightening correlation with NASDAQ risk-on flows means a sustained equity recovery through the next FOMC decision would amplify the spot demand signal rather than compete with it. The honest read: structure is bullish as long as spot CVD stays positive and ETF inflows don't reverse. The weekly close is the level to watch.

Frequently asked questions
-
What is spot CVD and why does the 199% surge matter?
Spot Cumulative Volume Delta measures the running difference between buy and sell volume on spot exchanges. The 199% surge signals aggressive net buying pressure — when both spot and perpetual CVD rise together, it confirms real demand rather than a futures-driven short squeeze.
-
How much did Bitcoin's spot CVD rise last week?
Bitcoin's spot CVD climbed from $18.3 million to $54.8 million over the prior week, a 199.1% increase. Parallel perpetual CVD rose 174.7% to $315.1 million, confirming the same directional pressure across both markets.
-
Are ETF inflows driving the current Bitcoin rally?
ETF inflows are re-accelerating after a three-day stretch of net outflows and providing the absorption layer that is holding Bitcoin above $78,000. BlackRock's IBIT gained 1.33% in the prior session as institutional demand returned.
-
What price levels are analysts watching for Bitcoin?
Bitcoin is trading around $77,000 intraday. A weekly close above $75,000 opens the path toward $80,000 and the $82,000 on-chain resistance cluster. A break below $75,000 puts the real floor near $72,000.
-
What is the risk case for the current Bitcoin rally?
The risk is an open interest flush. With open interest recovered to $25 billion and rising leverage, a sharp reversal could trigger a liquidation cascade. The structure remains bullish only as long as spot CVD stays positive and ETF inflows don't reverse.
 Altcoin Daily
 WatcherGuru
 Lookonchain
 Benjamin Cowen
 TheBlock
 CoinDesk
 WuBlockchain