 CoinDesk

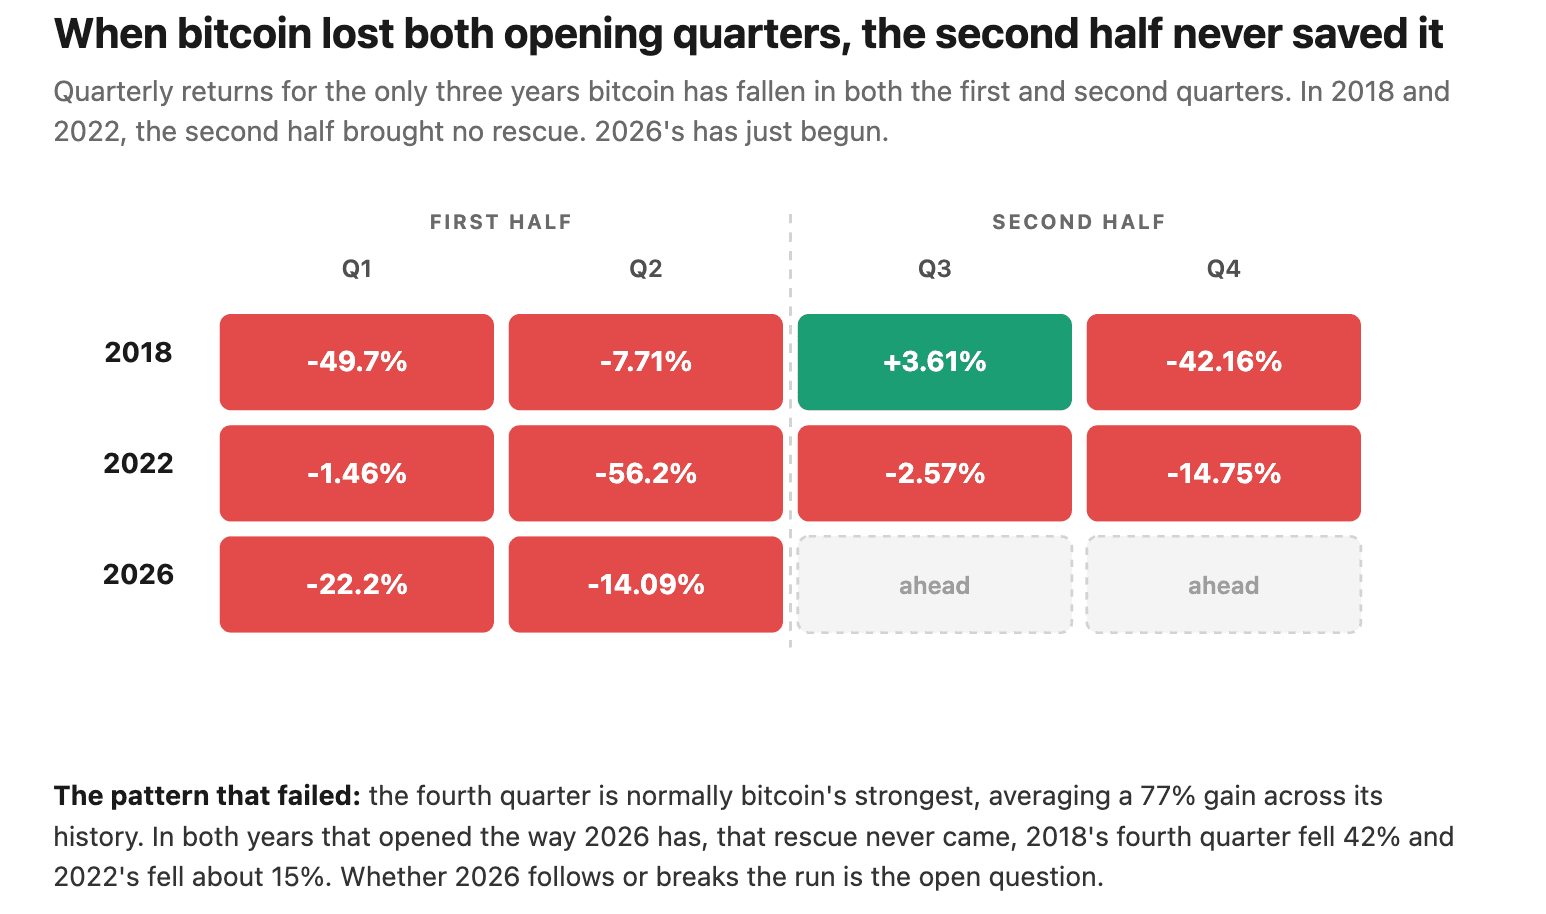


Bitcoin begins the third quarter of 2026 in its historically weakest stretch, after closing the first half with consecutive quarterly losses for only the third time in its history. Per Coinglass data, Bitcoin fell roughly 22.2% in Q1 and another 14.09% in Q2, trading just above $59,000 as July began.
The two prior instances in which BTC posted back-to-back losing quarters to open a year, 2018 and 2022, were both structural bear markets. In 2018, an unwinding of the ICO boom dragged prices lower; in 2022, the Terra and FTX collapses did the same. Neither year's seasonal tailwind showed up when it mattered: Q3 2018 managed only a 3.6% gain before Q4 collapsed 42%, and Q3 2022 fell 2.6% before Q4 dropped nearly 15%.
Why it matters
Across Bitcoin's full record, Q4 is its strongest quarter by a wide margin, averaging a 77% gain with a median near 48%, while Q3 tends to be flat or soft. In the two prior losing-first-half years, that usual Q4 lift failed outright, because the bear market overrode the calendar. With 2026 already matching the same opening pattern, the question is whether the current selloff is a passing dip or another structural break, and the underlying mechanics look closer to a grind than a panic.
Market impact
The pressure has come from steady, identifiable sources: record outflows from U.S. spot Bitcoin ETFs over the past month, subdued on-chain activity near the low end of its range, and rotation into AI stocks, which just posted their best quarter in years while crypto fell. A stronger dollar, reinforced this week by the Japanese yen's slide to a 40-year low, has added gravity. Analysts at FxPro, including Alex Kuptsikevich, have flagged $40,000 as the next meaningful support if $59K gives way. Q3 has so far opened with a modest ~1% gain, leaving the structural call unresolved.

Frequently asked questions
-
How much has Bitcoin fallen in the first half of 2026?
Per Coinglass data, BTC fell roughly 22.2% in Q1 and another 14.09% in Q2, trading just above $59,000 as Q3 began.
-
When was the last time Bitcoin opened a year with two consecutive losing quarters?
The two prior instances were 2018 and 2022, both structural bear markets whose Q4 strength failed despite BTC's usual seasonal tailwind.
-
Why are analysts watching $40,000 as the next support level?
Analysts including FxPro's Alex Kuptsikevich have flagged $40,000 as the next meaningful support if BTC loses the $59,000 area under sustained ETF outflows and dollar strength.
-
What is driving the current Bitcoin selloff?
Record outflows from U.S. spot BTC ETFs over the past month, subdued on-chain activity, rotation into AI stocks, and a stronger dollar reinforced by the yen sliding to a 40-year low.
-
Has Q4 always rescued weak Bitcoin starts to a year?
No. Q4 averages a 77% gain with a median near 48% across BTC's full record, but in both 2018 and 2022 Q4 closed sharply lower, breaking the seasonal pattern.