








 CoinDesk
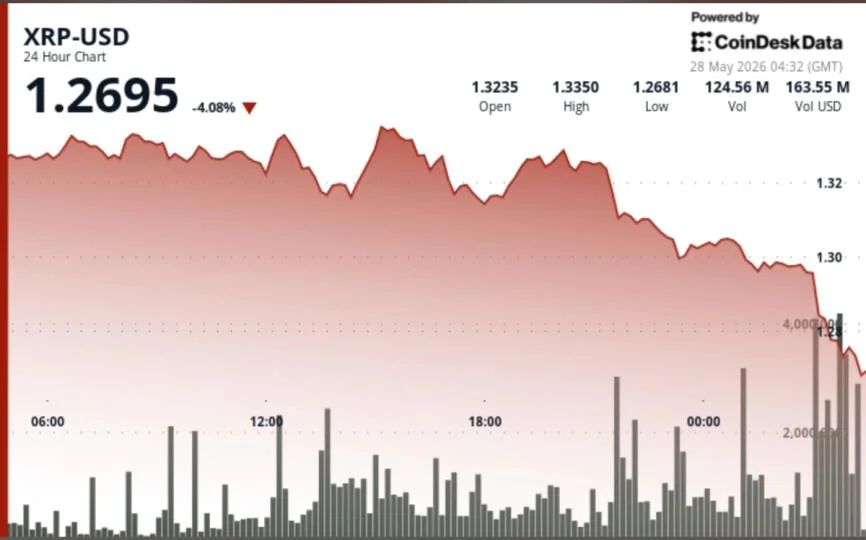


XRP broke below the long-defended $1.30 support on heavy volume during the May 27 session, falling from $1.3267 to $1.2993 over 24 hours and briefly tagging $1.2931 before a weak rebound back toward the $1.30 line. The sharpest wave of selling hit at 23:00 UTC, when 64 million XRP traded hands as price cracked support near $1.3150 — a clean breakdown rather than a slow drift.
The move matters because $1.30 had acted as a floor throughout the broader consolidation, with buyers stepping in repeatedly over recent months. This time the bids failed to hold, and sellers are now aggressively defending the $1.33–$1.36 zone overhead, capping any meaningful relief bounce.
Why it matters
XRP has been compressed inside a symmetrical triangle since early 2025, and price is now drifting toward the lower edge of that structure near the apex. Technical setups of this kind tend to resolve in the direction of the prevailing trend on breakout, and the prevailing trend here has been lower highs beneath $1.36 for weeks. A failure to reclaim $1.30 quickly opens the door to the mid-$1.20s and, if that floor gives way, the $1.10 area flagged by multiple analysts.
Derivatives positioning is also cooling — open interest fell through the session, a signal that trader conviction is weakening rather than building into the dip. That makes a violent short squeeze less likely and a slow grind lower more probable.
Market impact
The $1.30 line is now the level that defines short-term direction: reclaim it and the consolidation thesis survives for another leg; lose it on a daily close and the symmetrical-triangle resolution shifts decisively toward the downside.
On-chain flows still show XRP leaving exchanges, which some traders read as longer-term accumulation against the spot weakness — a divergence between paper positioning and physical movement that has held through prior drawdowns. The broader risk backdrop is also weighing on the move: a fresh wave of U.S. airstrikes near the Strait of Hormuz dragged Bitcoin below $73,000 and wiped out nearly $1 billion in leveraged crypto positions in 24 hours, with longs making up roughly 93% of the liquidations.

Frequently asked questions
-
Why did XRP drop below $1.30?
Heavy selling hit during the May 27 23:00 UTC session, with 64M XRP trading as price cracked support near $1.3150. The breakdown came after weeks of weakening beneath resistance near $1.35 and a broader risk-off move across crypto majors.
-
What is the symmetrical triangle pattern on XRP?
XRP has been compressed inside a symmetrical triangle since early 2025, with price drifting toward the lower edge near the apex. Technical structures of this kind typically resolve in the direction of the prevailing trend on breakout — here, that trend has been lower highs beneath $1.36.
-
What levels should XRP traders watch now?
$1.30 is the immediate reclaim level for short-term stabilization. The $1.2931 session low is the breakdown reference. Failure there opens the mid-$1.20s, and a deeper break puts the $1.10 area — flagged by multiple analysts — in play.
-
Are XRP derivatives showing weakness?
Open interest fell through the session, signaling weaker trader conviction across futures markets. Cooling positioning reduces the odds of a violent short-squeeze recovery and points toward a slower grind lower rather than a sharp rebound.
-
Is anyone still accumulating XRP despite the drop?
On-chain data shows XRP continuing to leave exchanges, a pattern some traders read as longer-term accumulation. The signal diverges from the spot weakness, but the broader risk-off move across majors — triggered by U.S. airstrikes near the Strait of Hormuz — is weighing on price action.
 Crypto Capital Venture
 Crypto News
 TheBlock
 CryptoSlate
 Crypto Rank News
 WuBlockchain